Project Overview
Trip management is a feature that has helped fleet owners and operational managers track the trips of their vehicles, increasing revenue by saving time and fuel consumption.
The goal behind redesigning the feature was to increase user satisfaction and improve the engagement.
Before Redesign
Overview
As I interviewed users from different segments and measured the engagement, I got to know that most of the user were not using the feature because they find it difficult and complex to create trips and there was a lot of important KPI's were also missing for user to make decision on the next action.
Impact
After the redesign of feature there was significant increase in engagement and user satisfaction. This has also resultant 60 percent increase in NPS score. We were successfully able to make the feature useful based on different industries requirement (Bus and Truck).
Duration
6 months
Team
I was the sole designer or the project, working along one front-end and backend developer.
Role
Product Strategy, User Research, User experience, End to End Visual Design + Interactions
Tools
Adobe XD, Figma and Adobe Illustrator, Zeplin, Draw.io
Problem Statement
For the operational manager, managing each vehicle trip data point in different places and understanding where they could save resources and time was becoming difficult.
Users wanted to track the ETA of the vehicle so users could plan a trip in advance for a vehicle to utilize their resources more proficiently. So, over time, it becomes difficult to track whether the driver has taken route deviation or not.
Don’t know ETA
Operational manager don’t have the ETA to decide the next trip for the vehicle
Unauthorised stoppage
The driver making stop at their hometown in between a trips
Fuel Theft
Fuel theft happening in between the trips at certain location
Route Deviation
No information of the route diversion done by the driver which had let the trip to get late
Breakdown and vehicle health
If breakdown happened send a alternative vehicle on its place but there is no record of the change that has happened in the trip
Solution
The feature needed to be redesigned, as the solution was not efficient enough to help the users accomplish their goals and needs.
1. Providing ETA for each trip
2. Tracking trip late, on time and early status for start and end
3. Giving the option to the user to mark geofence to track route deviation
4. Capturing fuel theft incidents and fuel consumption in a trip
5. Managing breakdown happened in between trip
6. Tracking the location
7. Gathering Alert info based on driver behaviour
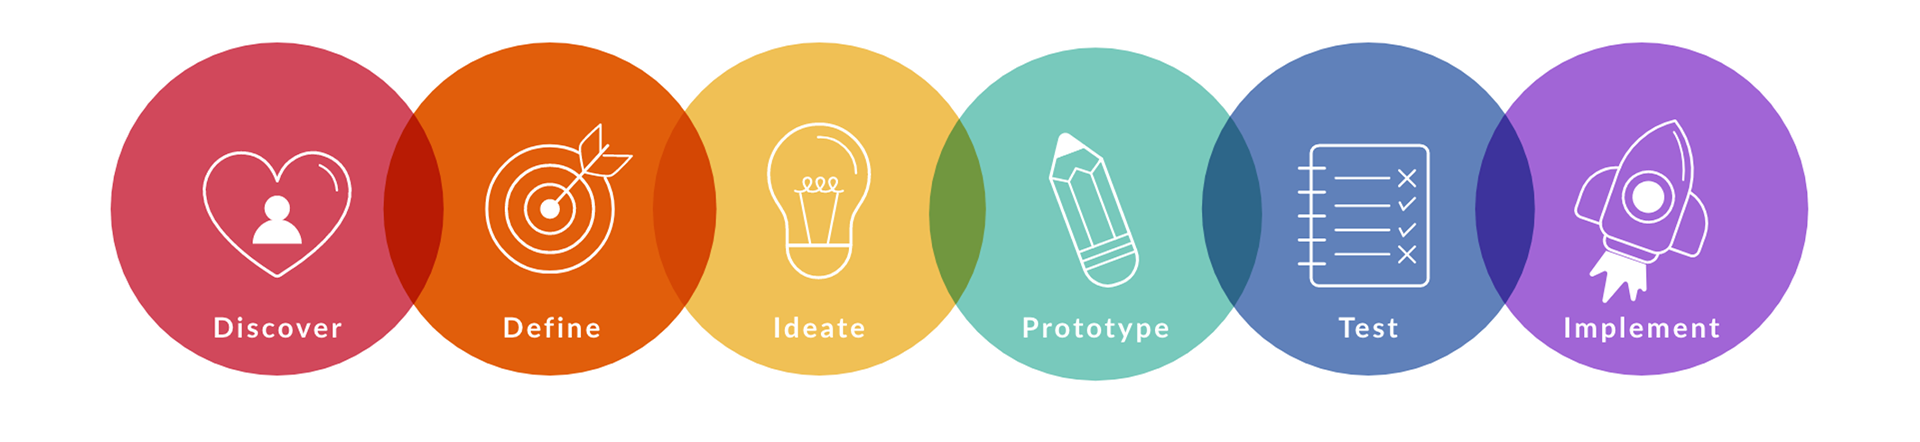
Design Process
As experience designer for this project I was responsible for the both 'research' and 'interface'.
Target Audience: Bus and Truck Industry
User Research
Quantitative Research
Quantitative UX research is the research strategy that focuses on quantifying the collection and analysis of numerical data. It can be used to find patterns and averages, make predictions, test causal relationships, and generalize results to wider populations.
Survey Question
Qualitative Research
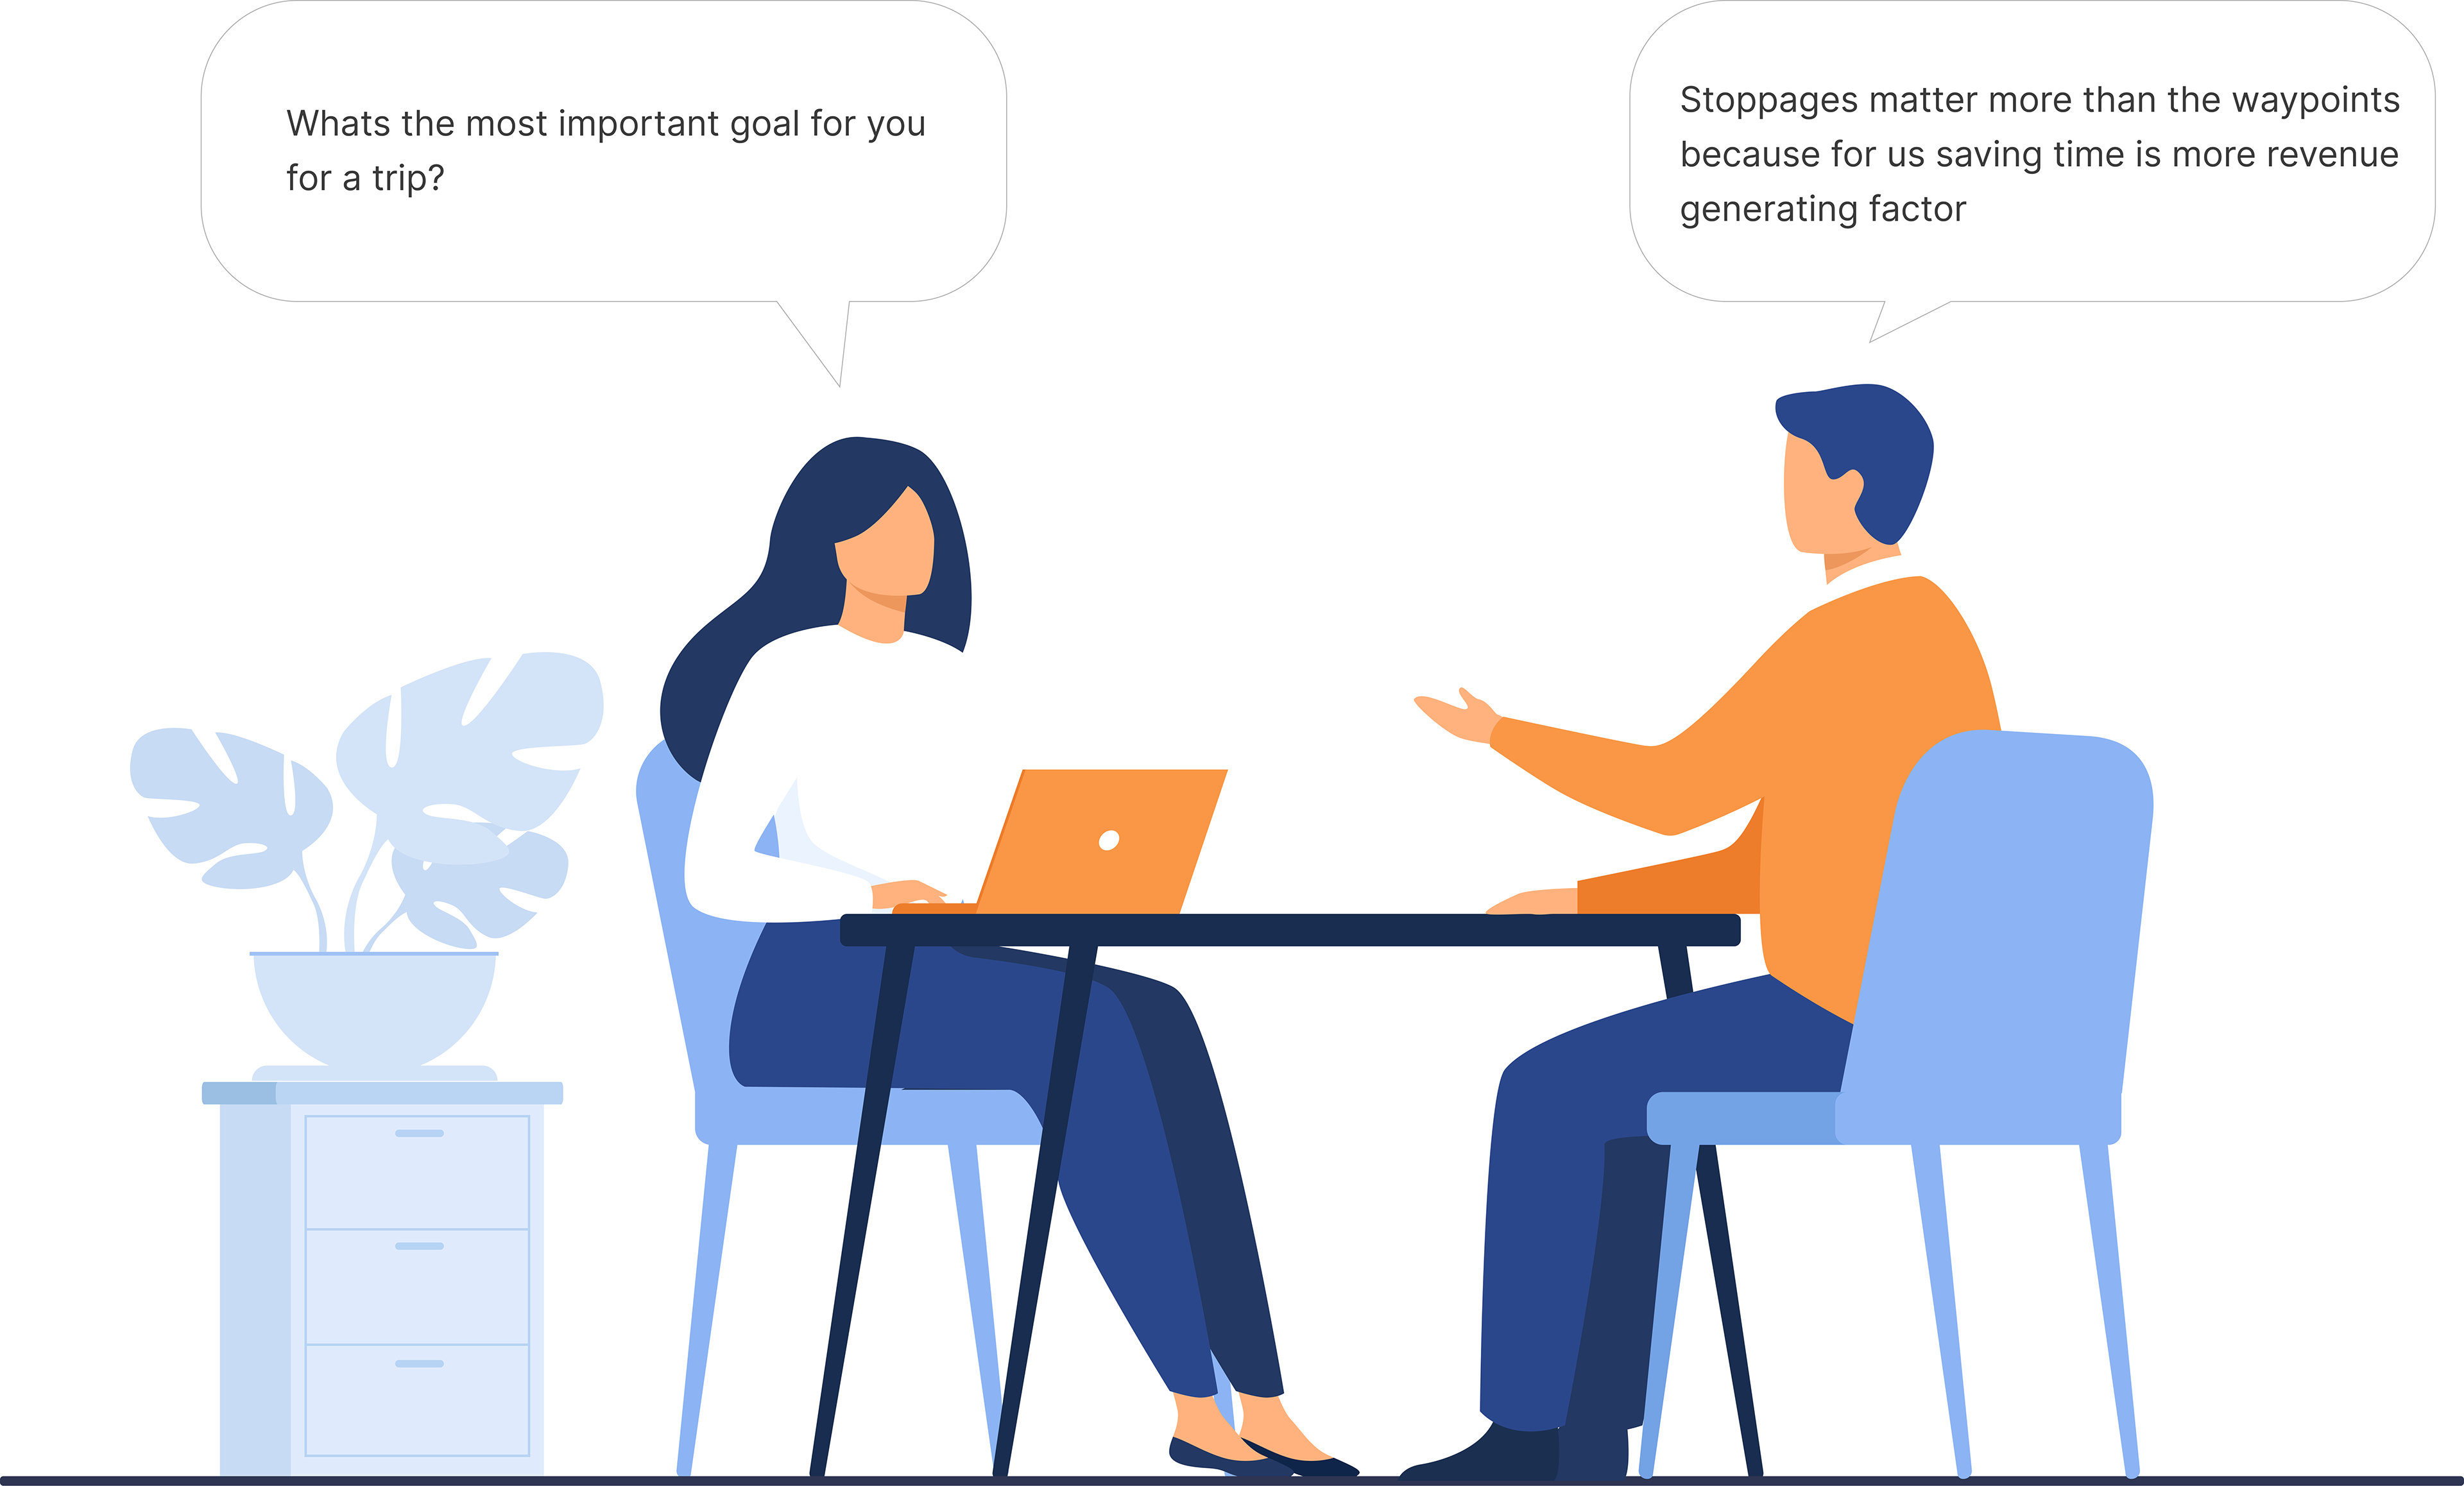
I have interviewed around 9 to 10 people who working as operational manager in the truck and bus industry to understand what difficult they are while doing their jobs and existing problem that user is facing in the current solution.
Interview Insights
Every user has different needs. I had to design something that fulfilled the requirements of as many users as possible. To give all the information to the user in one place for every single trip so he doesn’t have to visit different tabs to collect the information that is required by him for a trip.
Truck Industry
Stoppages are more significant than waypoints. If the goal is to reduce transit time, the truck can be sent on another trip early, increasing resource utilization and revenue.
Bus Industry
Users analyze the waypoint frequently because customers are waiting at the stop, and for the bus, the time of arrival is important.
If a bus is delayed, the customer gives it a low rating, which affects its revenue and business.
If a bus is delayed, the customer gives it a low rating, which affects its revenue and business.
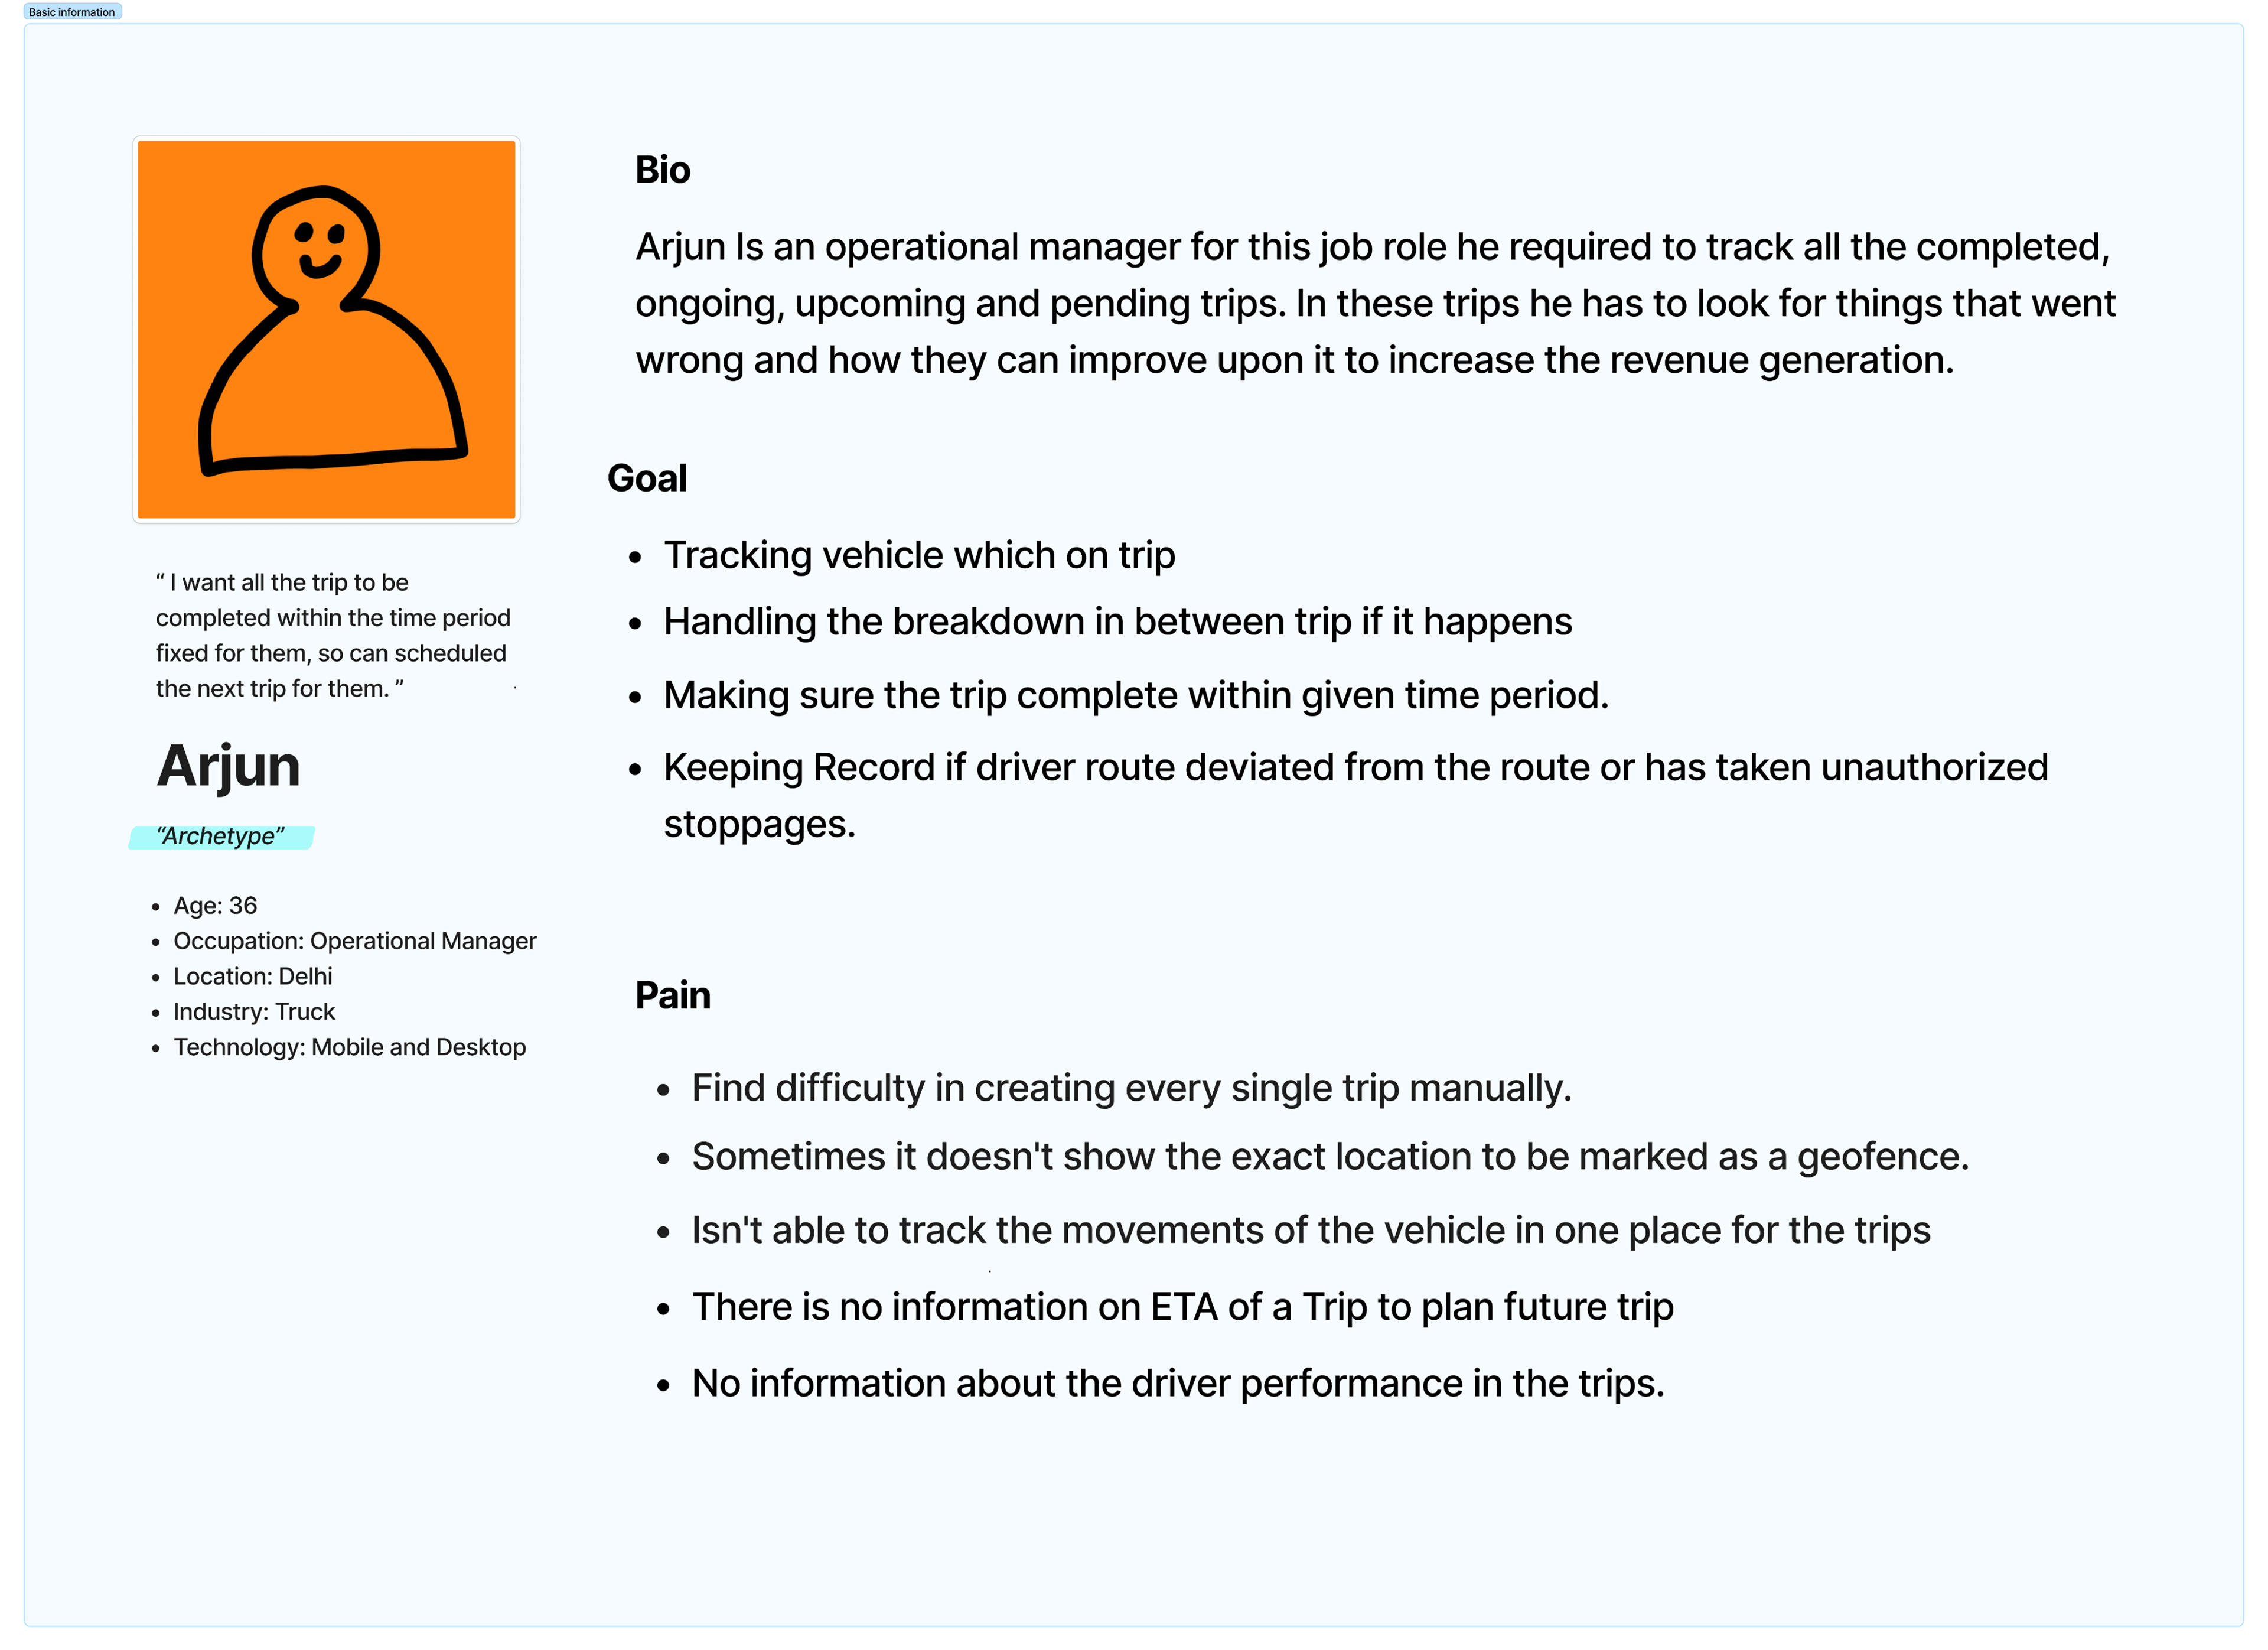
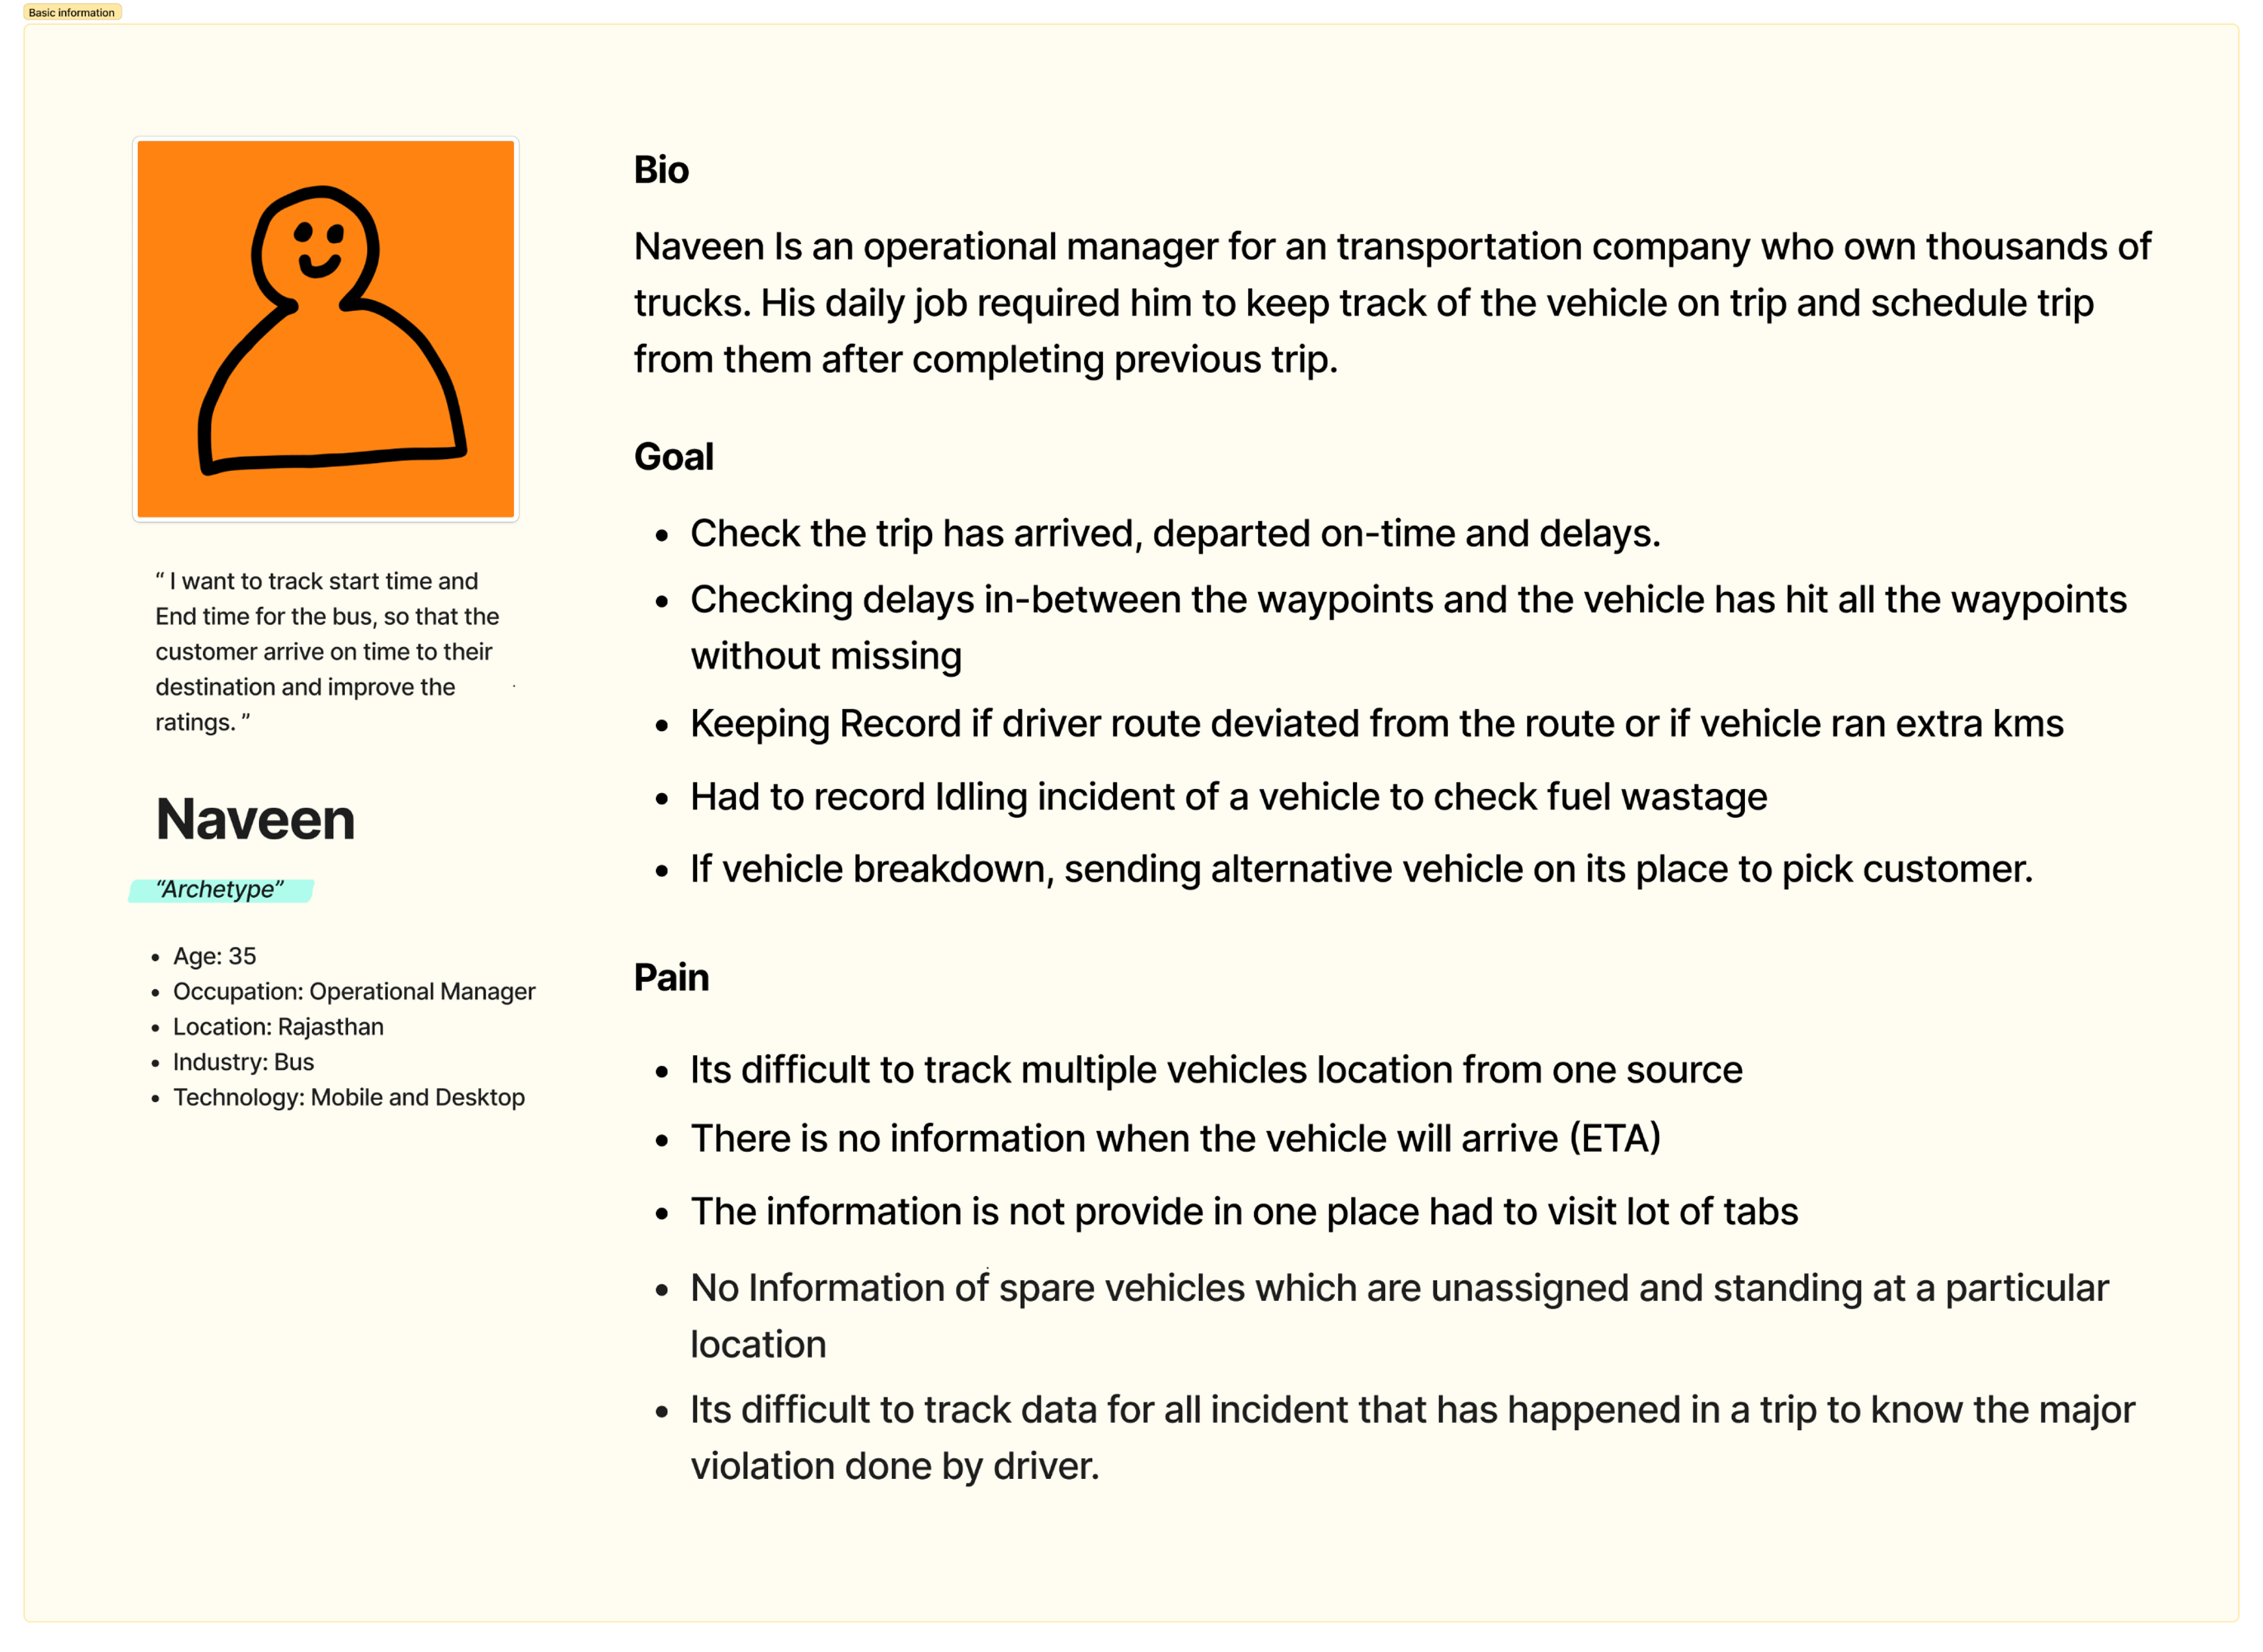
Personas
Truck: Operational Manager
Bus: Operational Manager
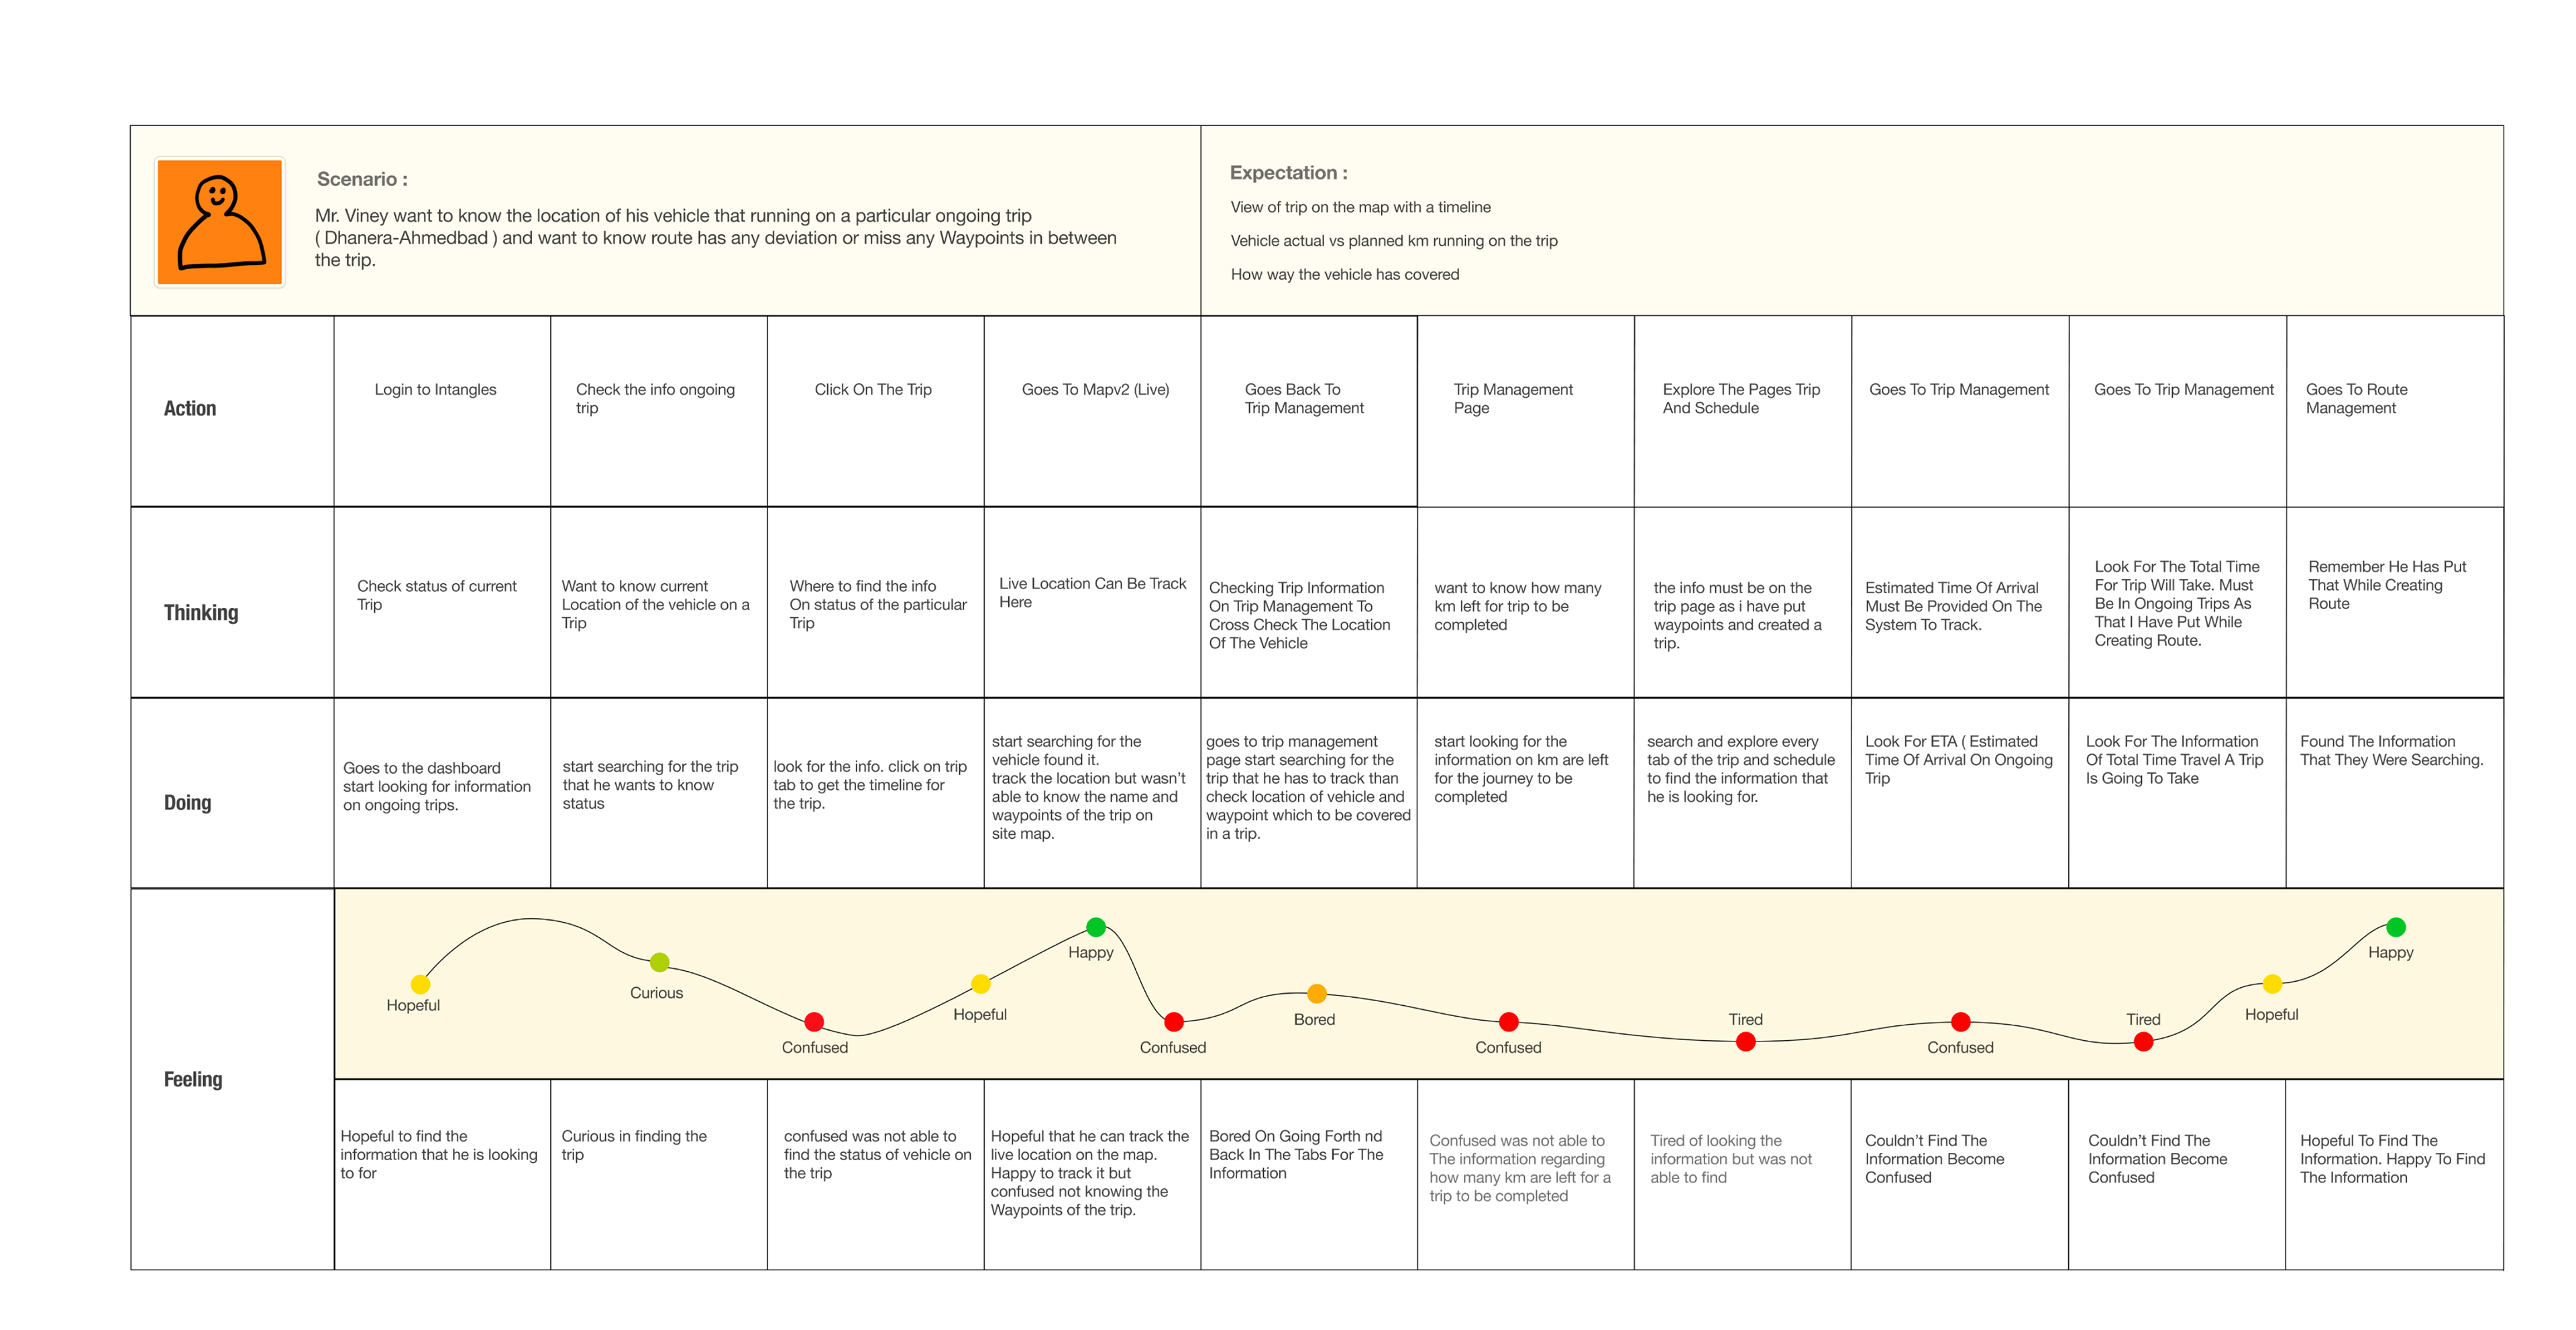
Journey Mapping
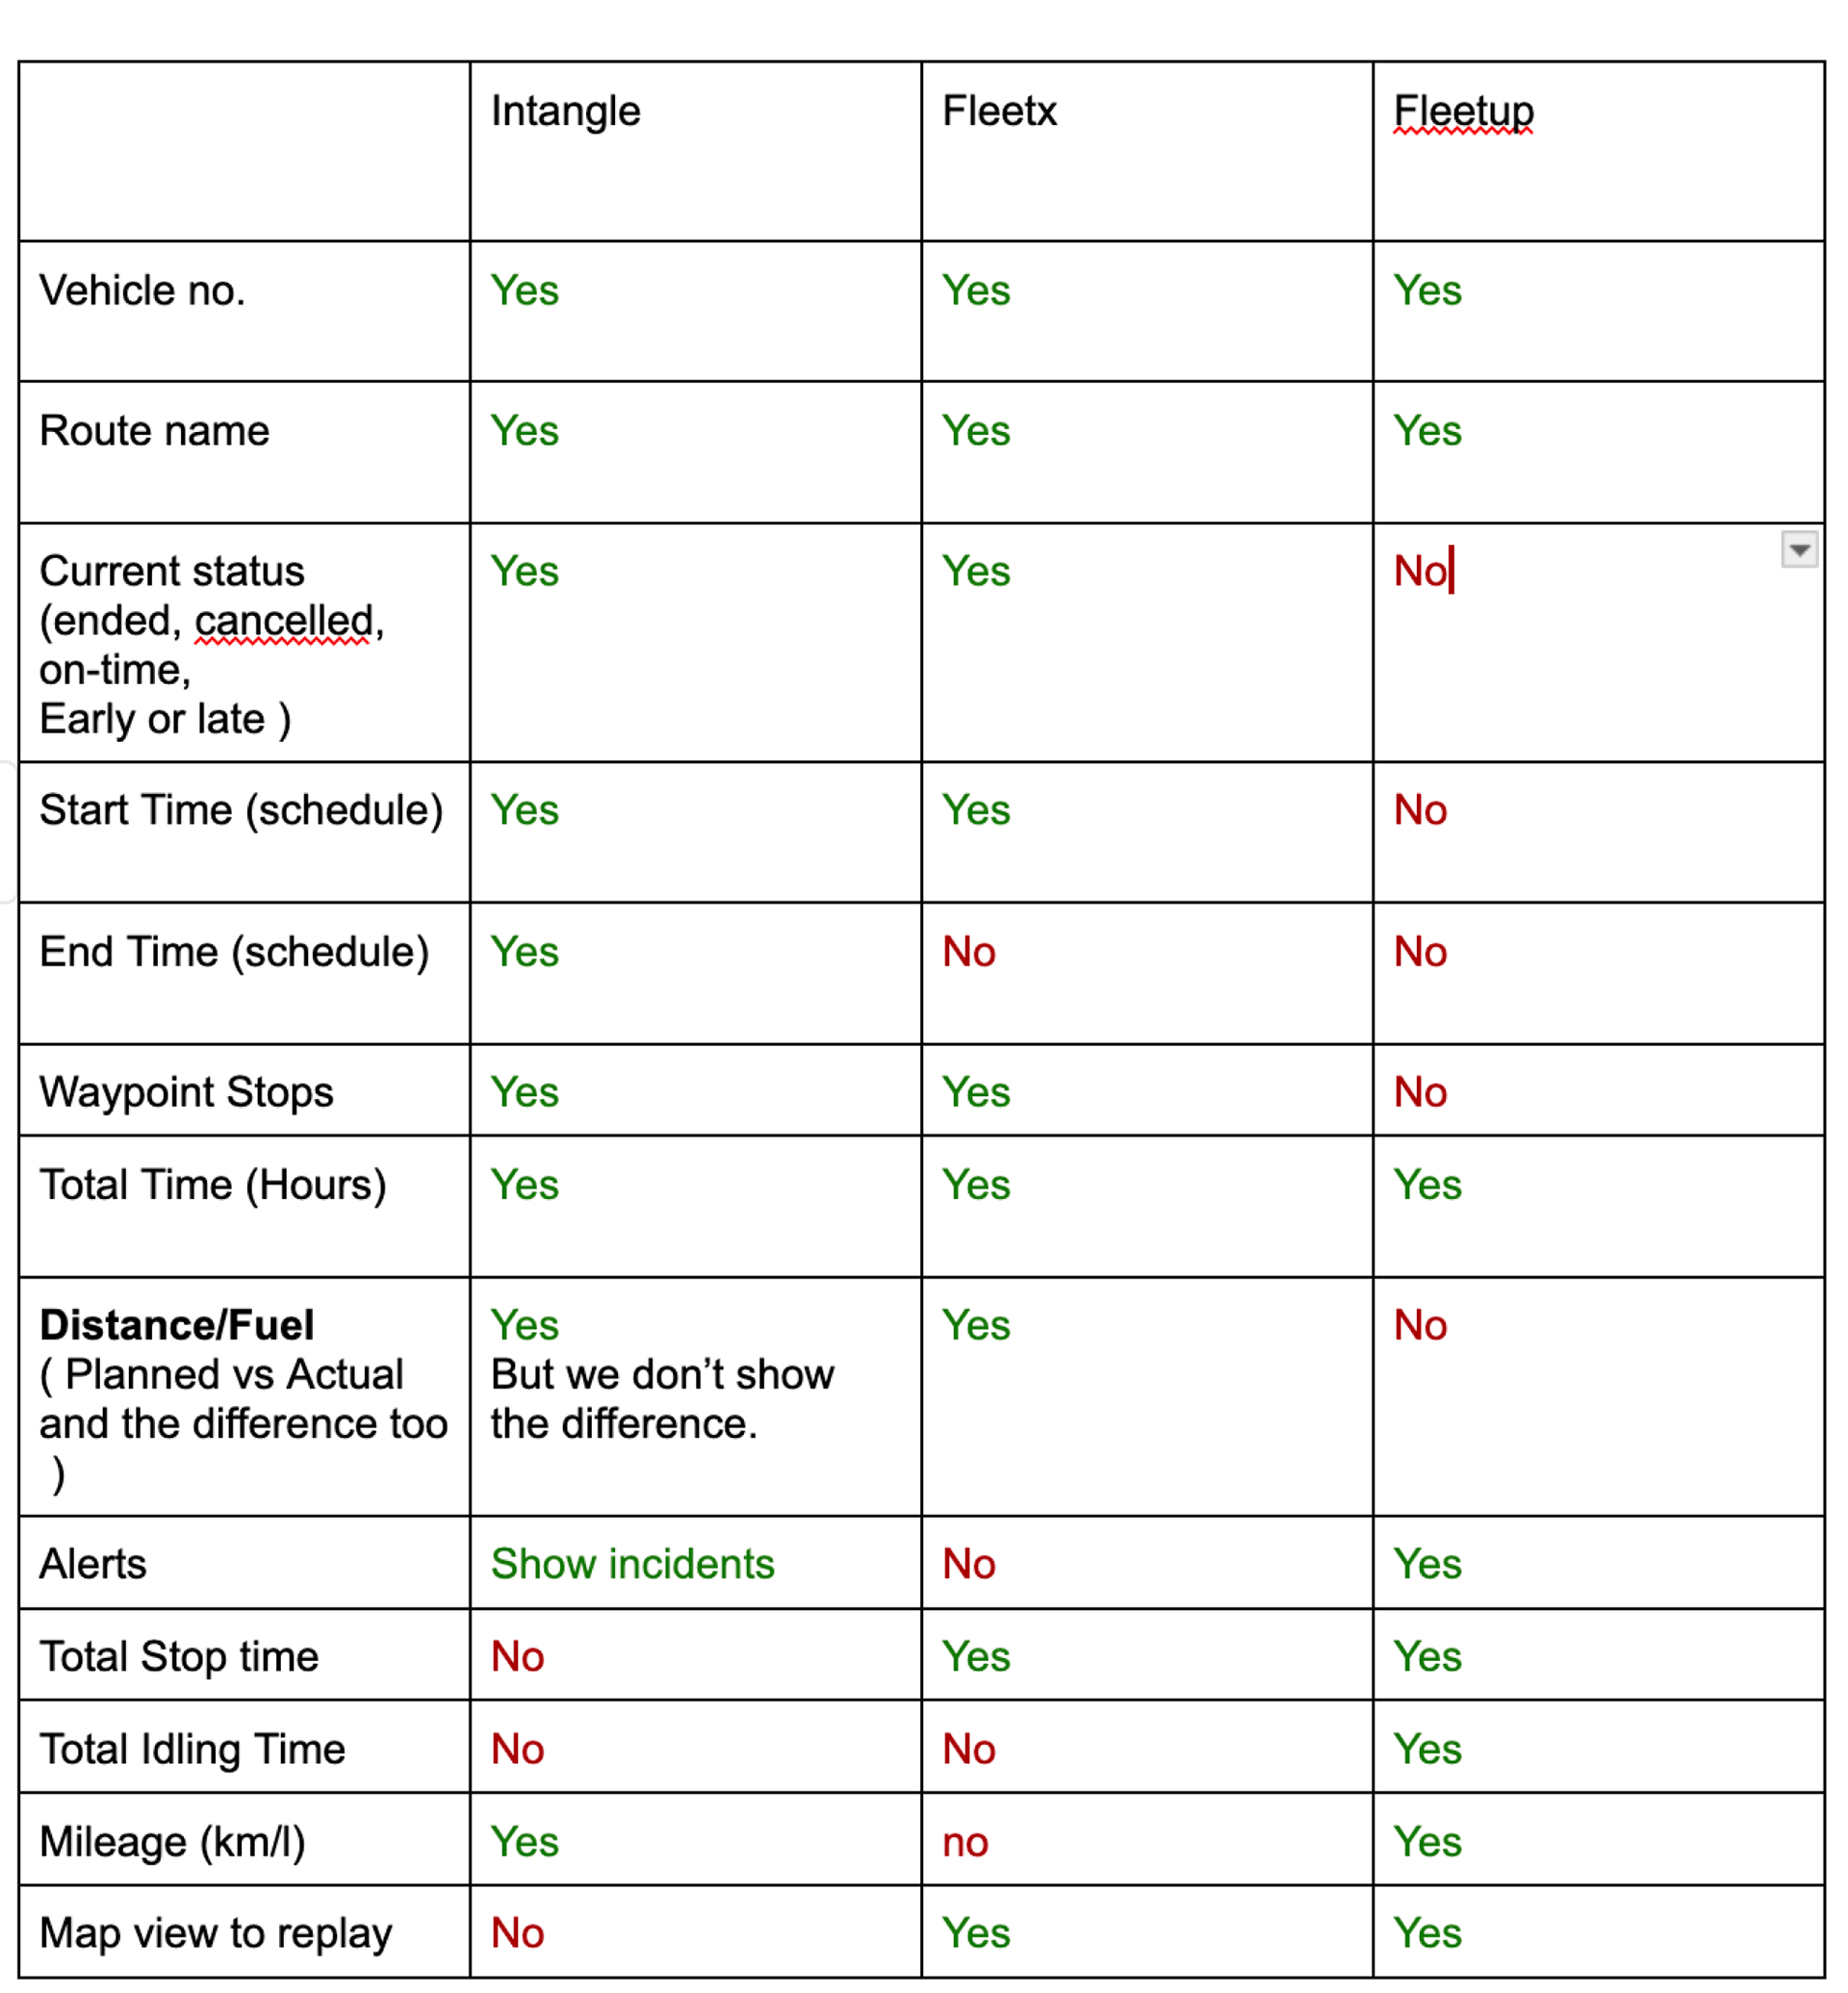
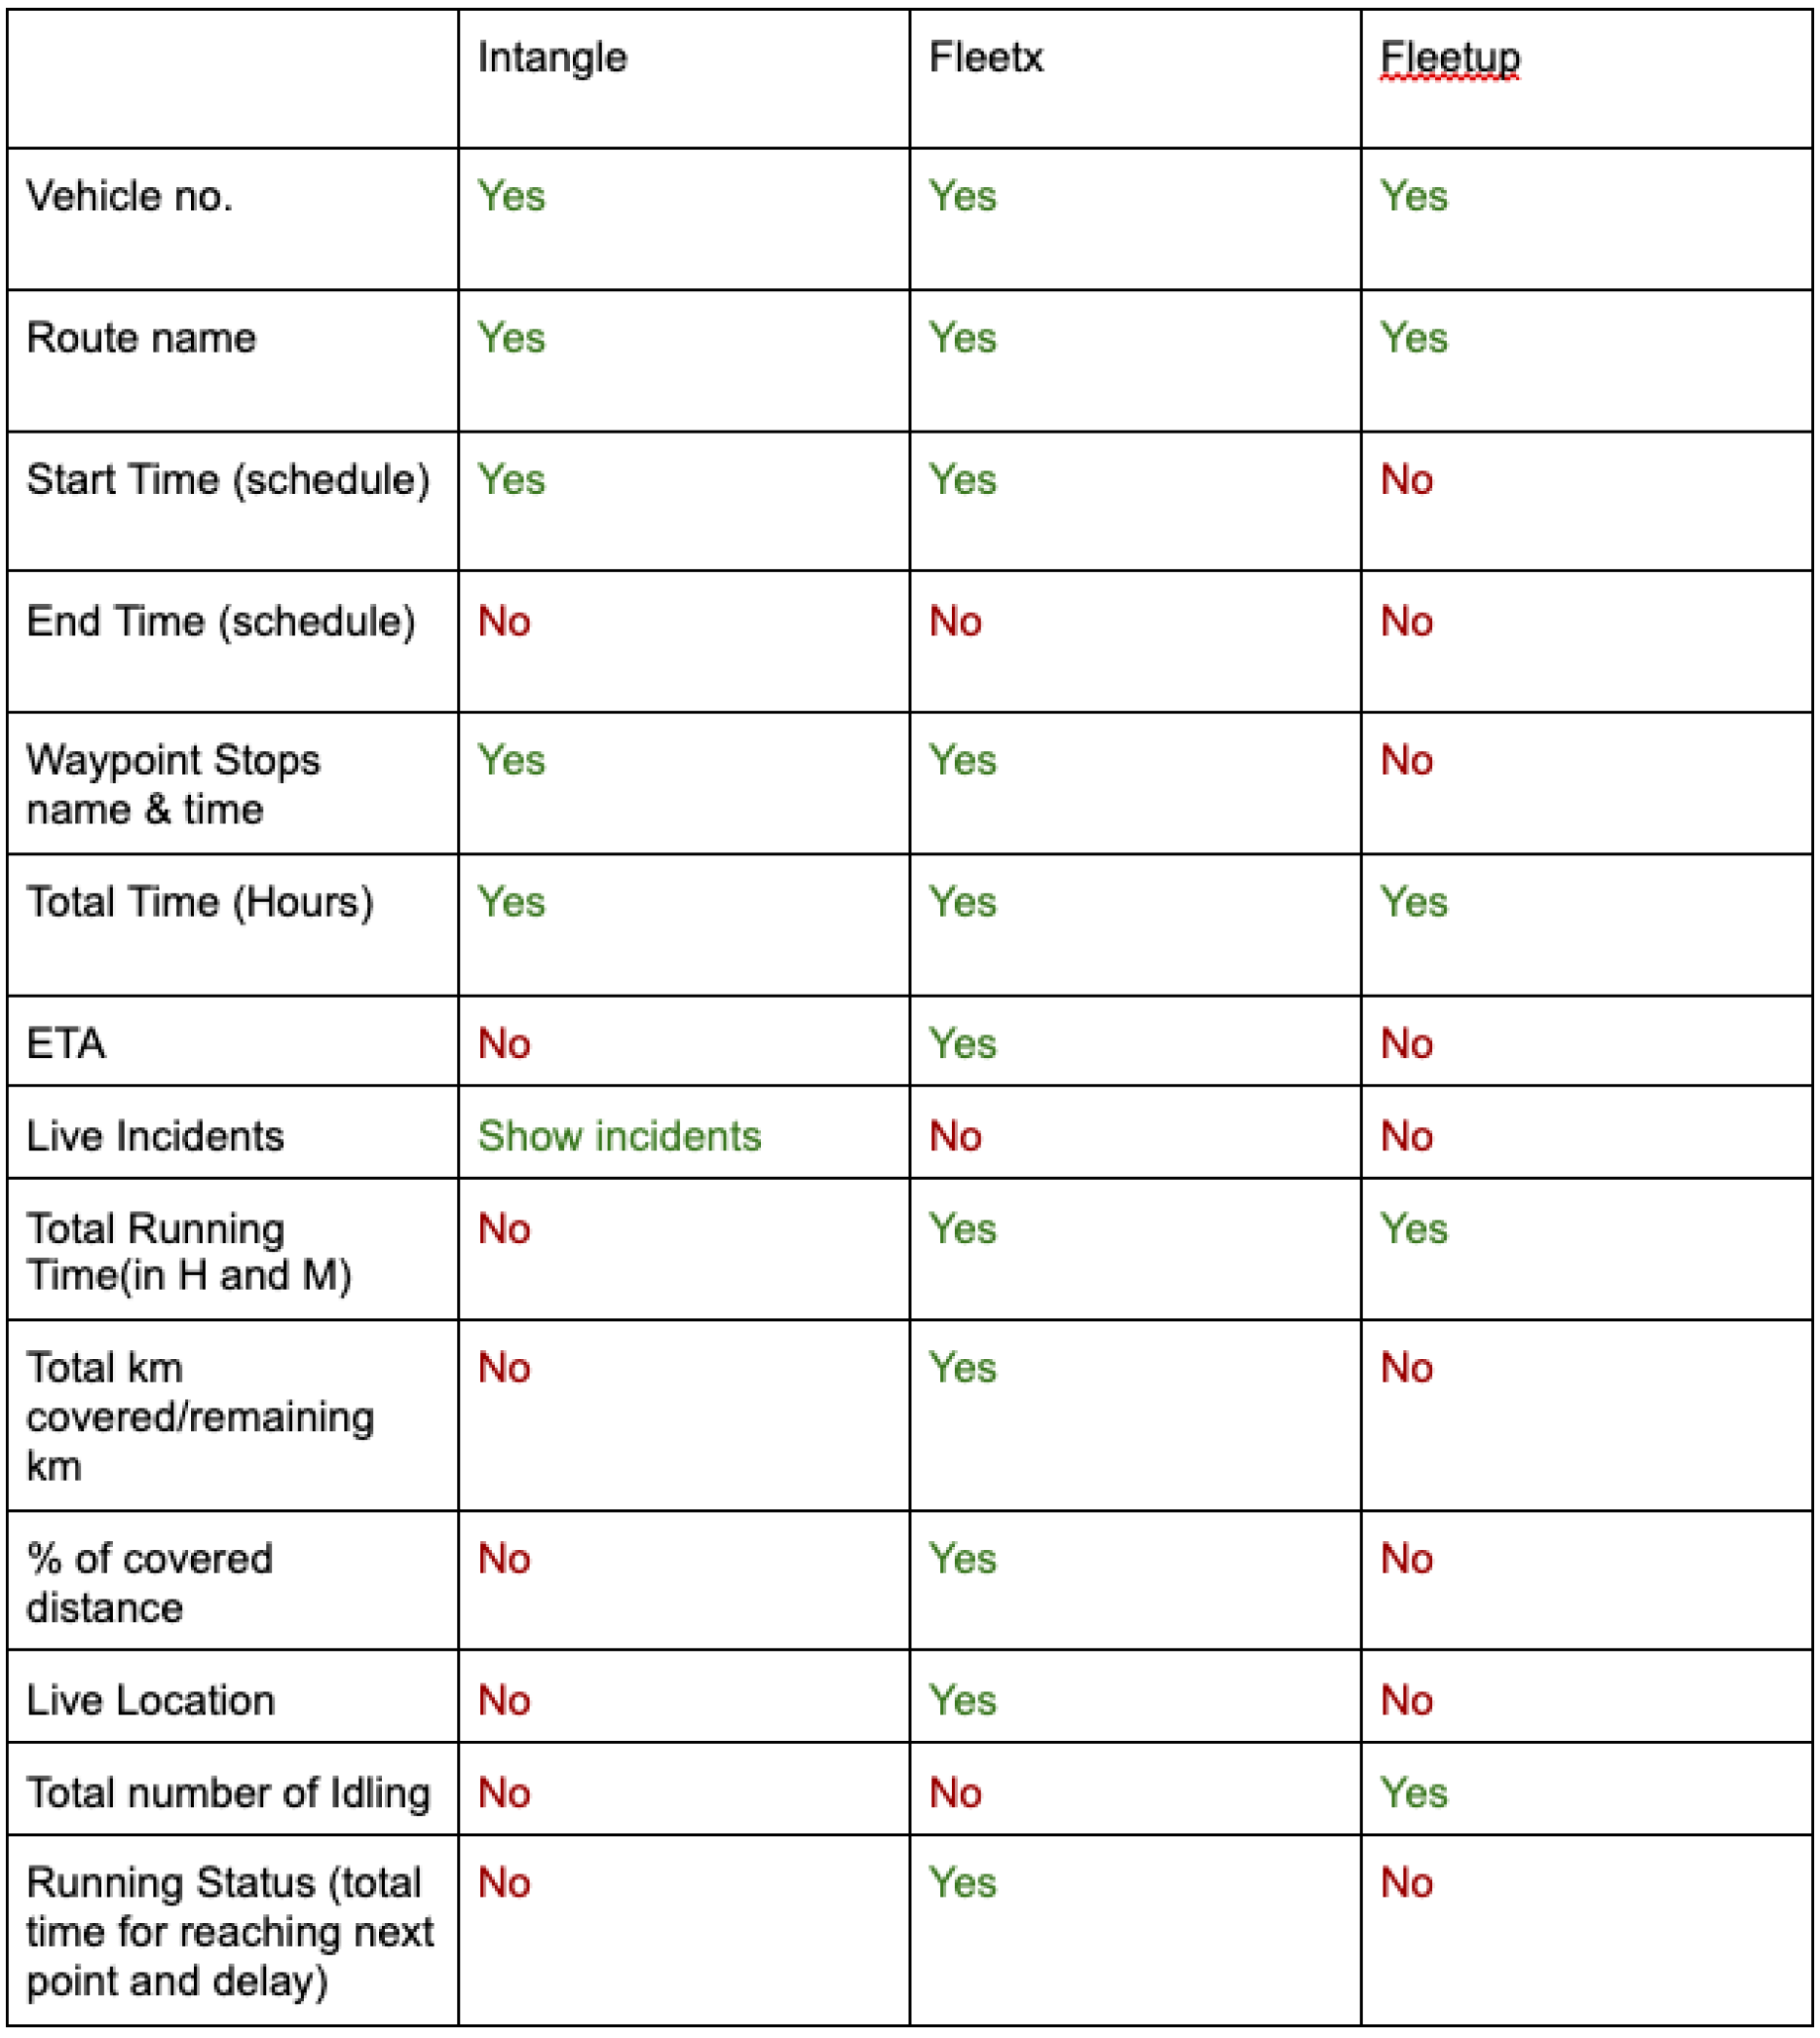
Competitive Analysis
I did a lot of research to find out the competition that I can analyse But the data that I got is in pieces.
Samsara has given the option of measuring the trip that is finished on Route TIme, Distance and Stop Time DIfference. They show the difference of actual vs planned in all categories above. Show in a graph form as well.
Fleetx is more focused on providing information related to the trip as compared to vehicle maintenance. Fleetx is also showing information of the trips on their main page of the map with the filtration based on time, late, early, assigned and unassigned vehicle location in the map view with details about it at what location it is driving for ongoing trips. For the finished trip, it has a tab called control room where the user gets all the information about the trips.
From the fleetup, I found most data about the finished trip. How they are representing the data.
Completed Trips
Ongoing Trips
Feature
1. Complete
2. Ongoing
3. Upcoming
4. Pending
5. Dashboard
6. Create Trip
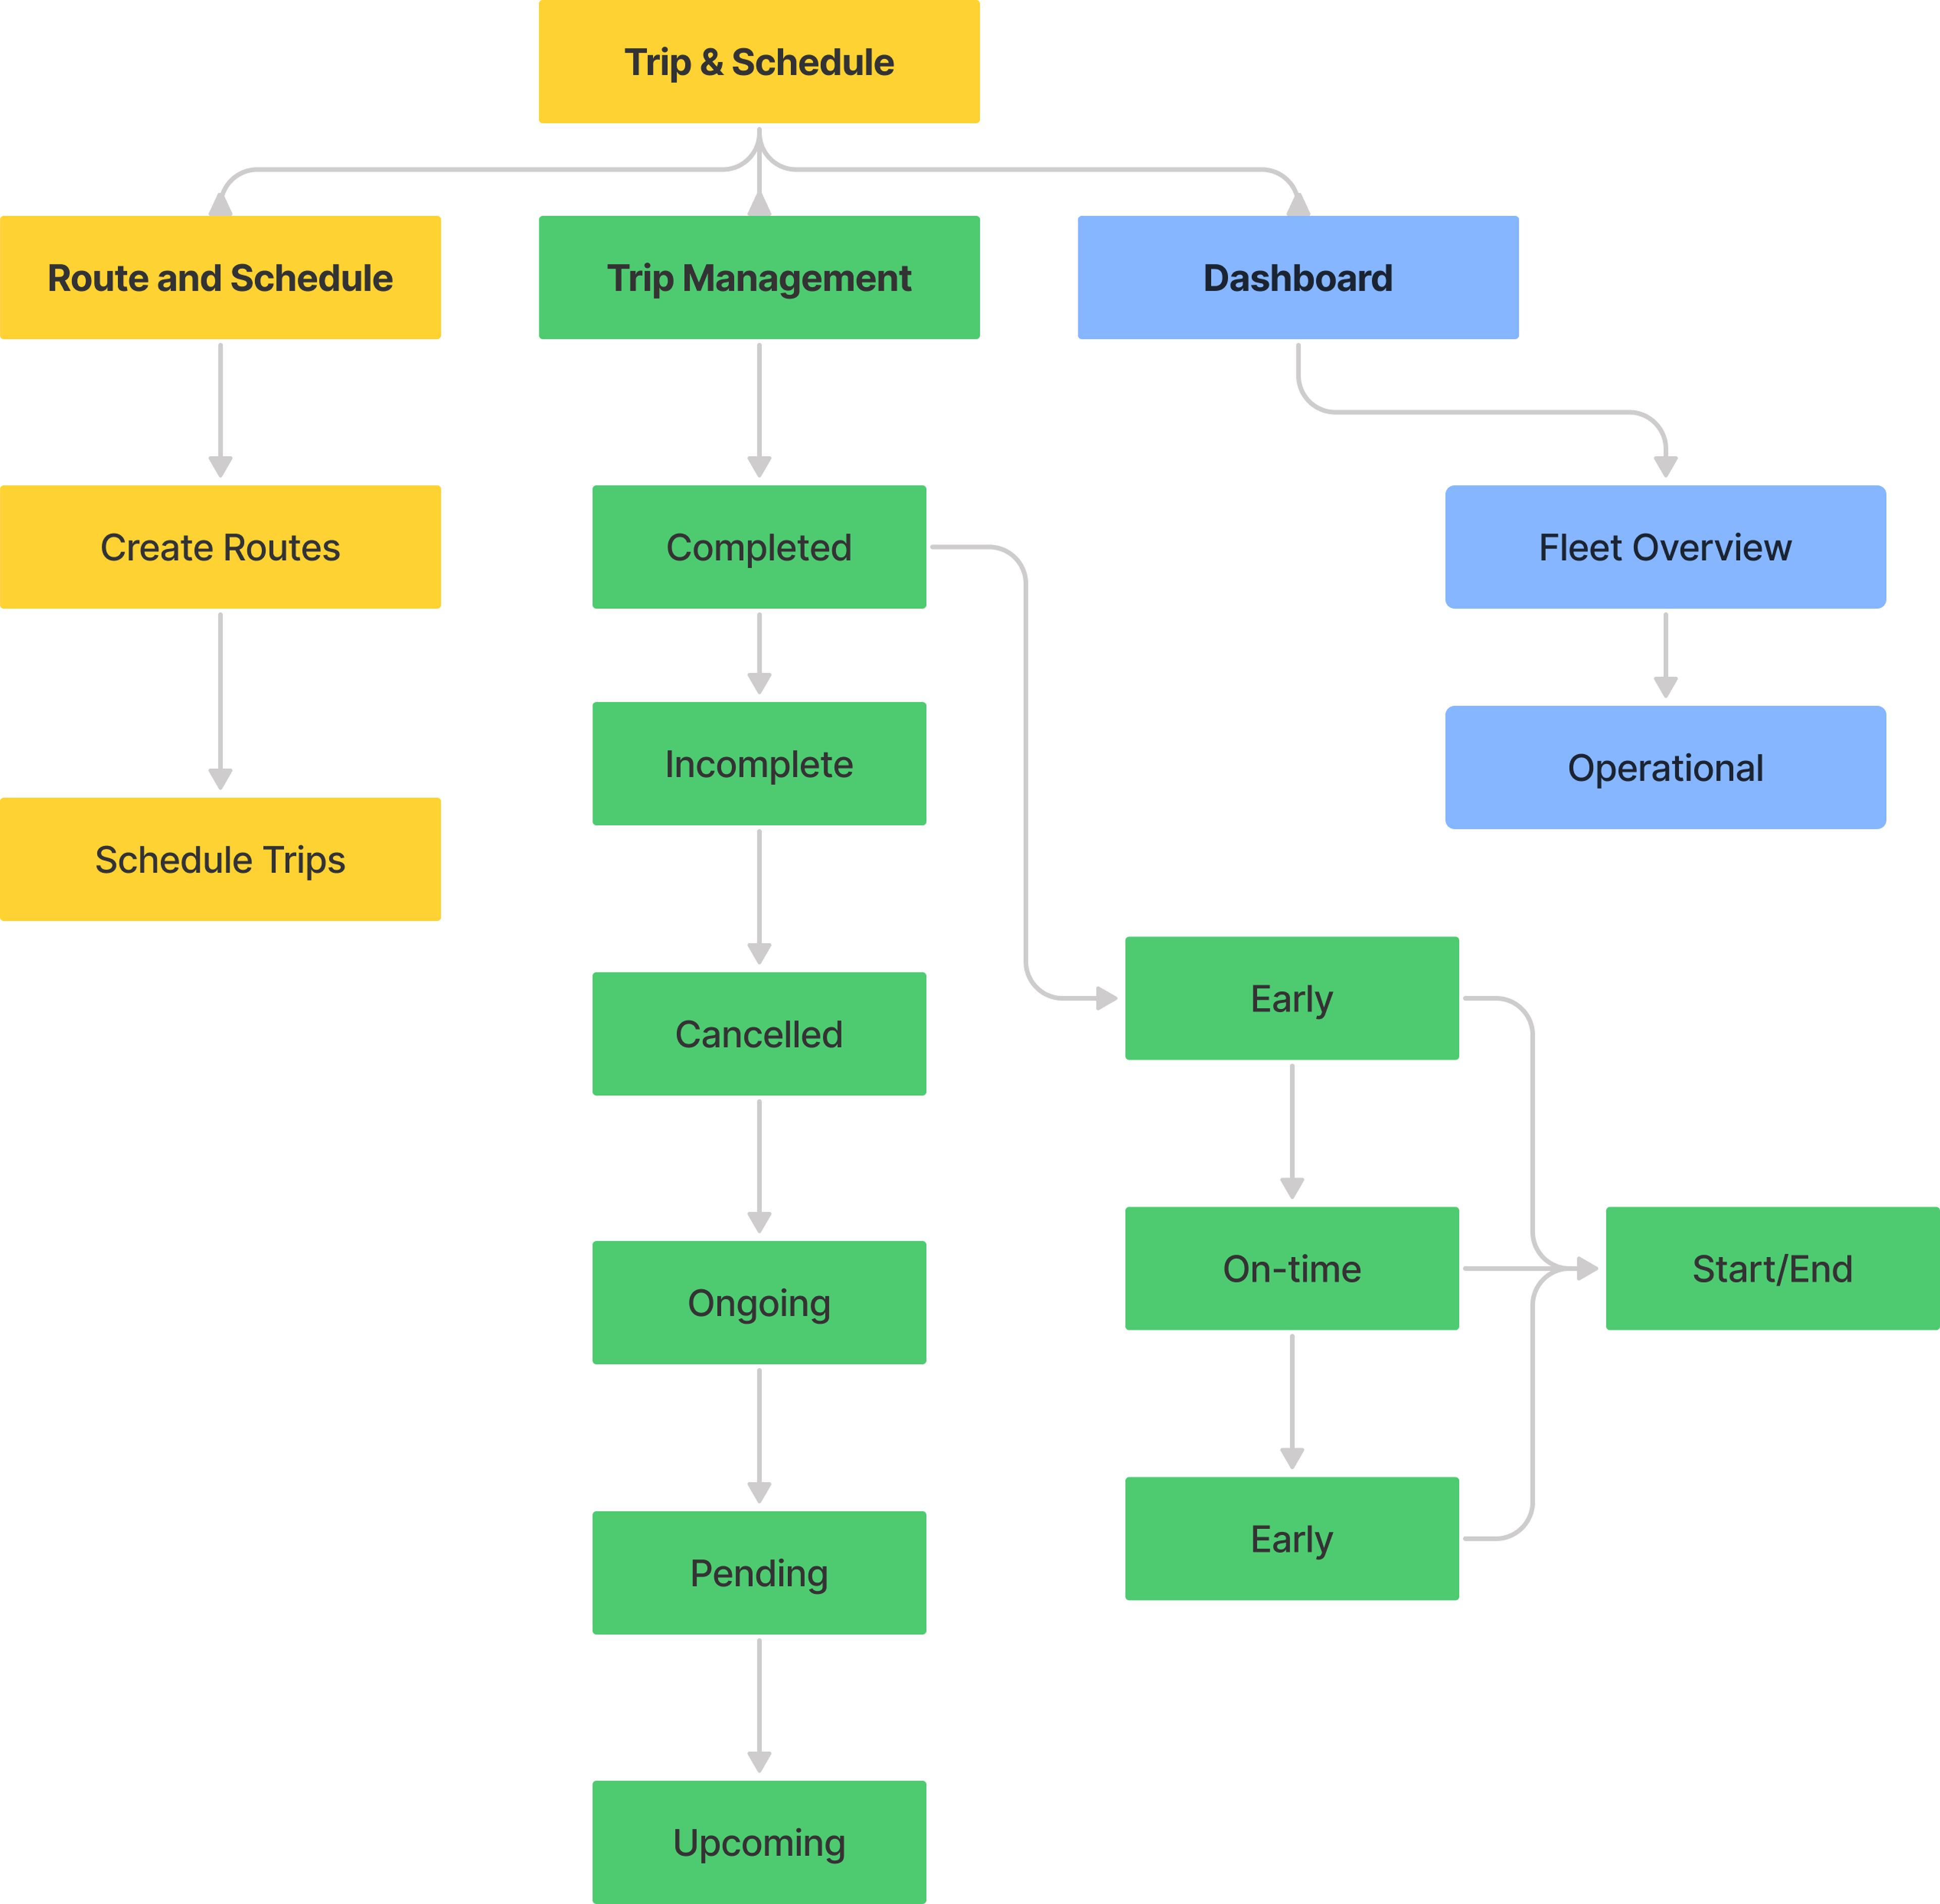
Information Architecture
Information architecture (IA) was created after taking all the essential considerations and gathering the data points to be included in the section for the each data table. The goal is to help users the information that can help them to increase their revenue, creditability and trust among their own customer.
Design Principles
Straight Forward
Simple - easy to understand
Make it less complicated
Consistent and Accessible
Rough Sketches
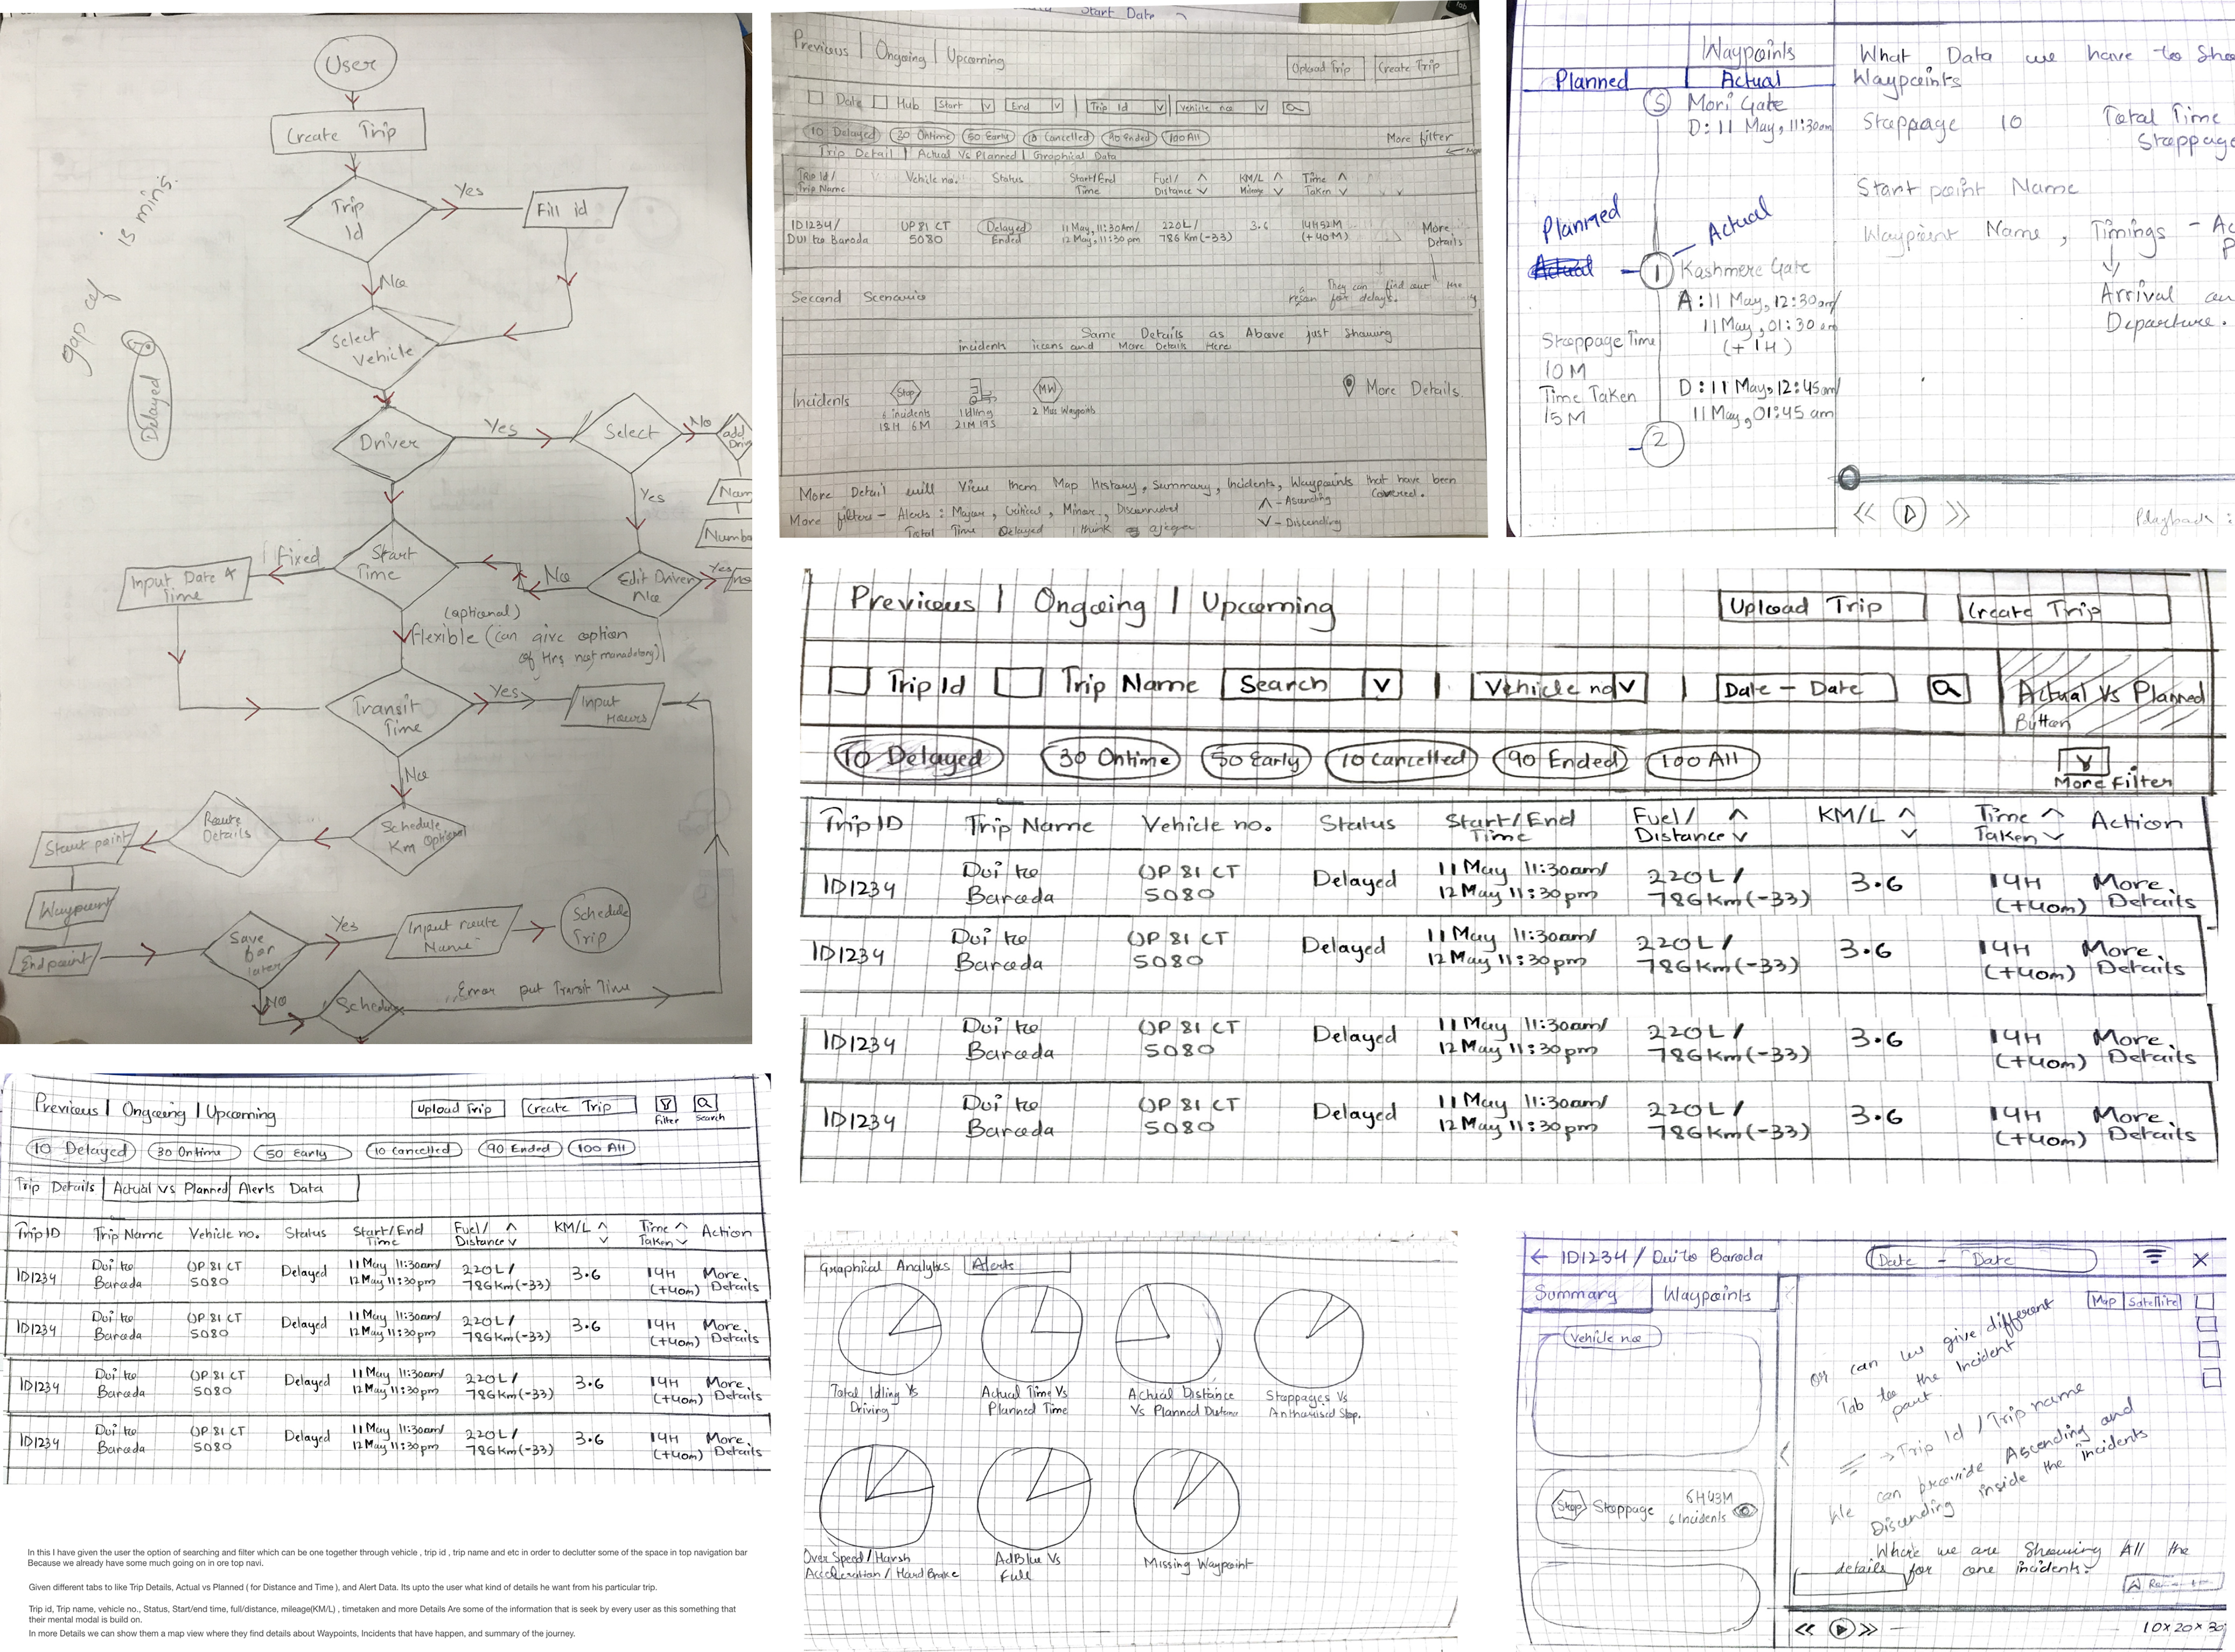
Low-fi Wireframes
Low-fidelity wireframes are basic wireframes in which I outline blueprints for app screens. This help me communicate with my team “the idea” and tested out with the users.
Before Redesign
Below is the design that was on the platform before the redesign. In the redesign, we have added new KPIs and information that can help the user improve their business and more efficiently utilize their assets.

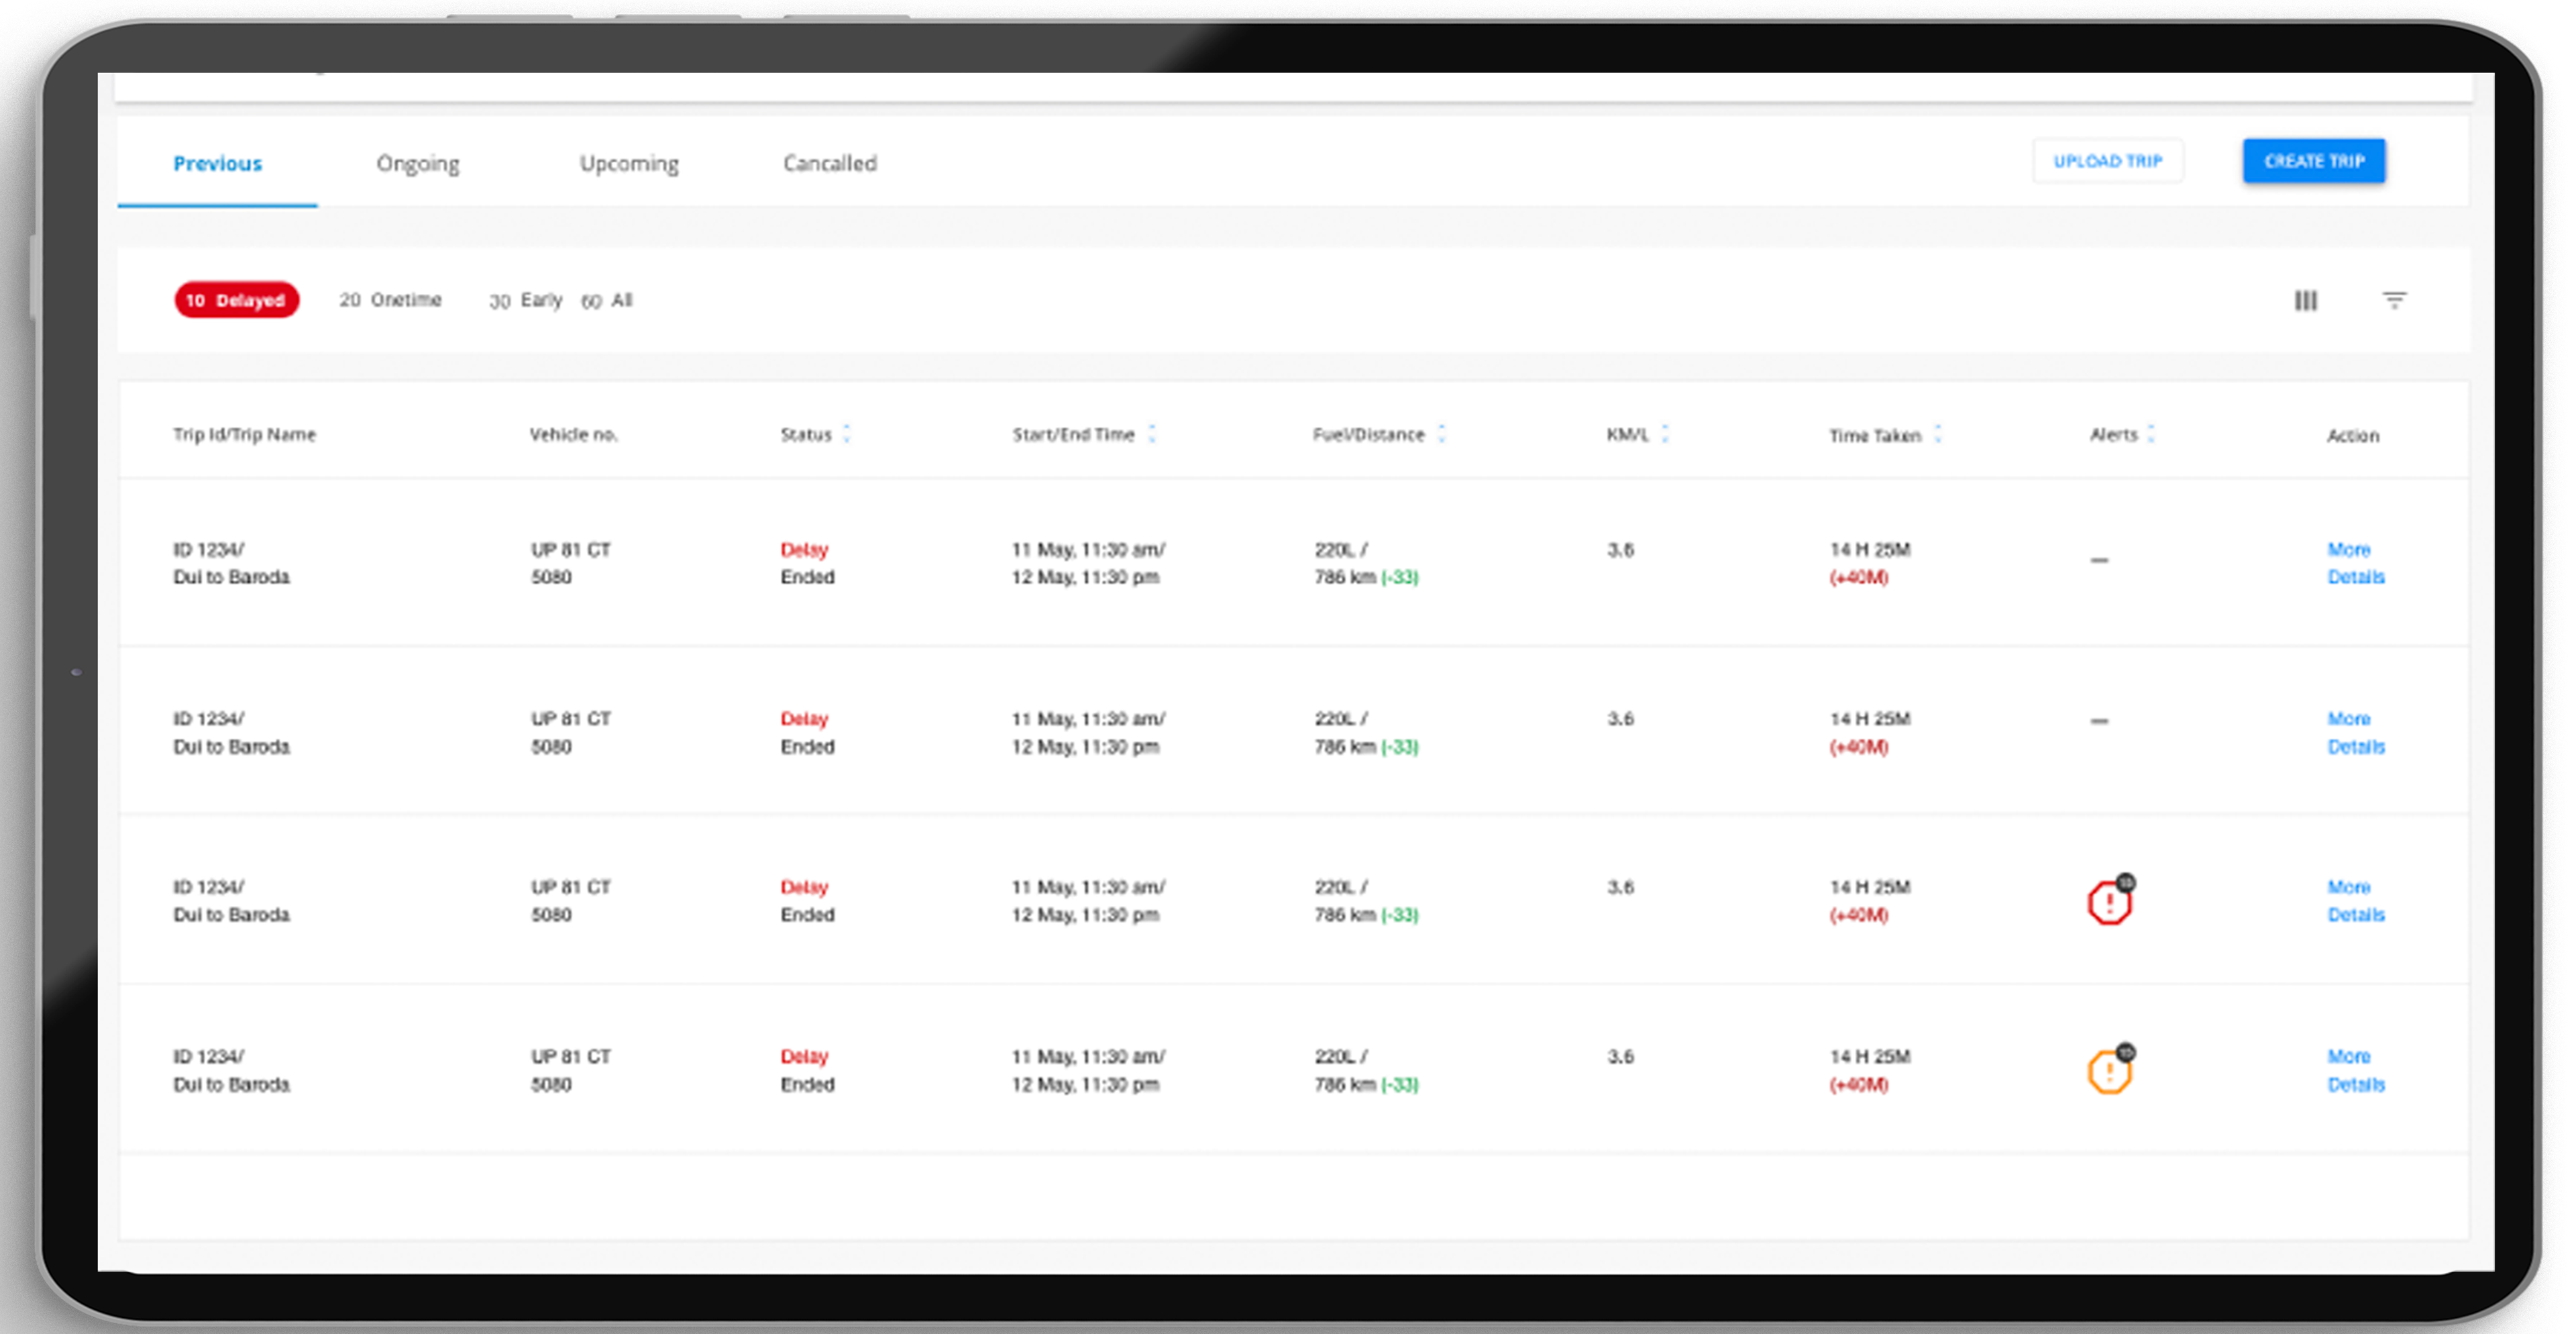
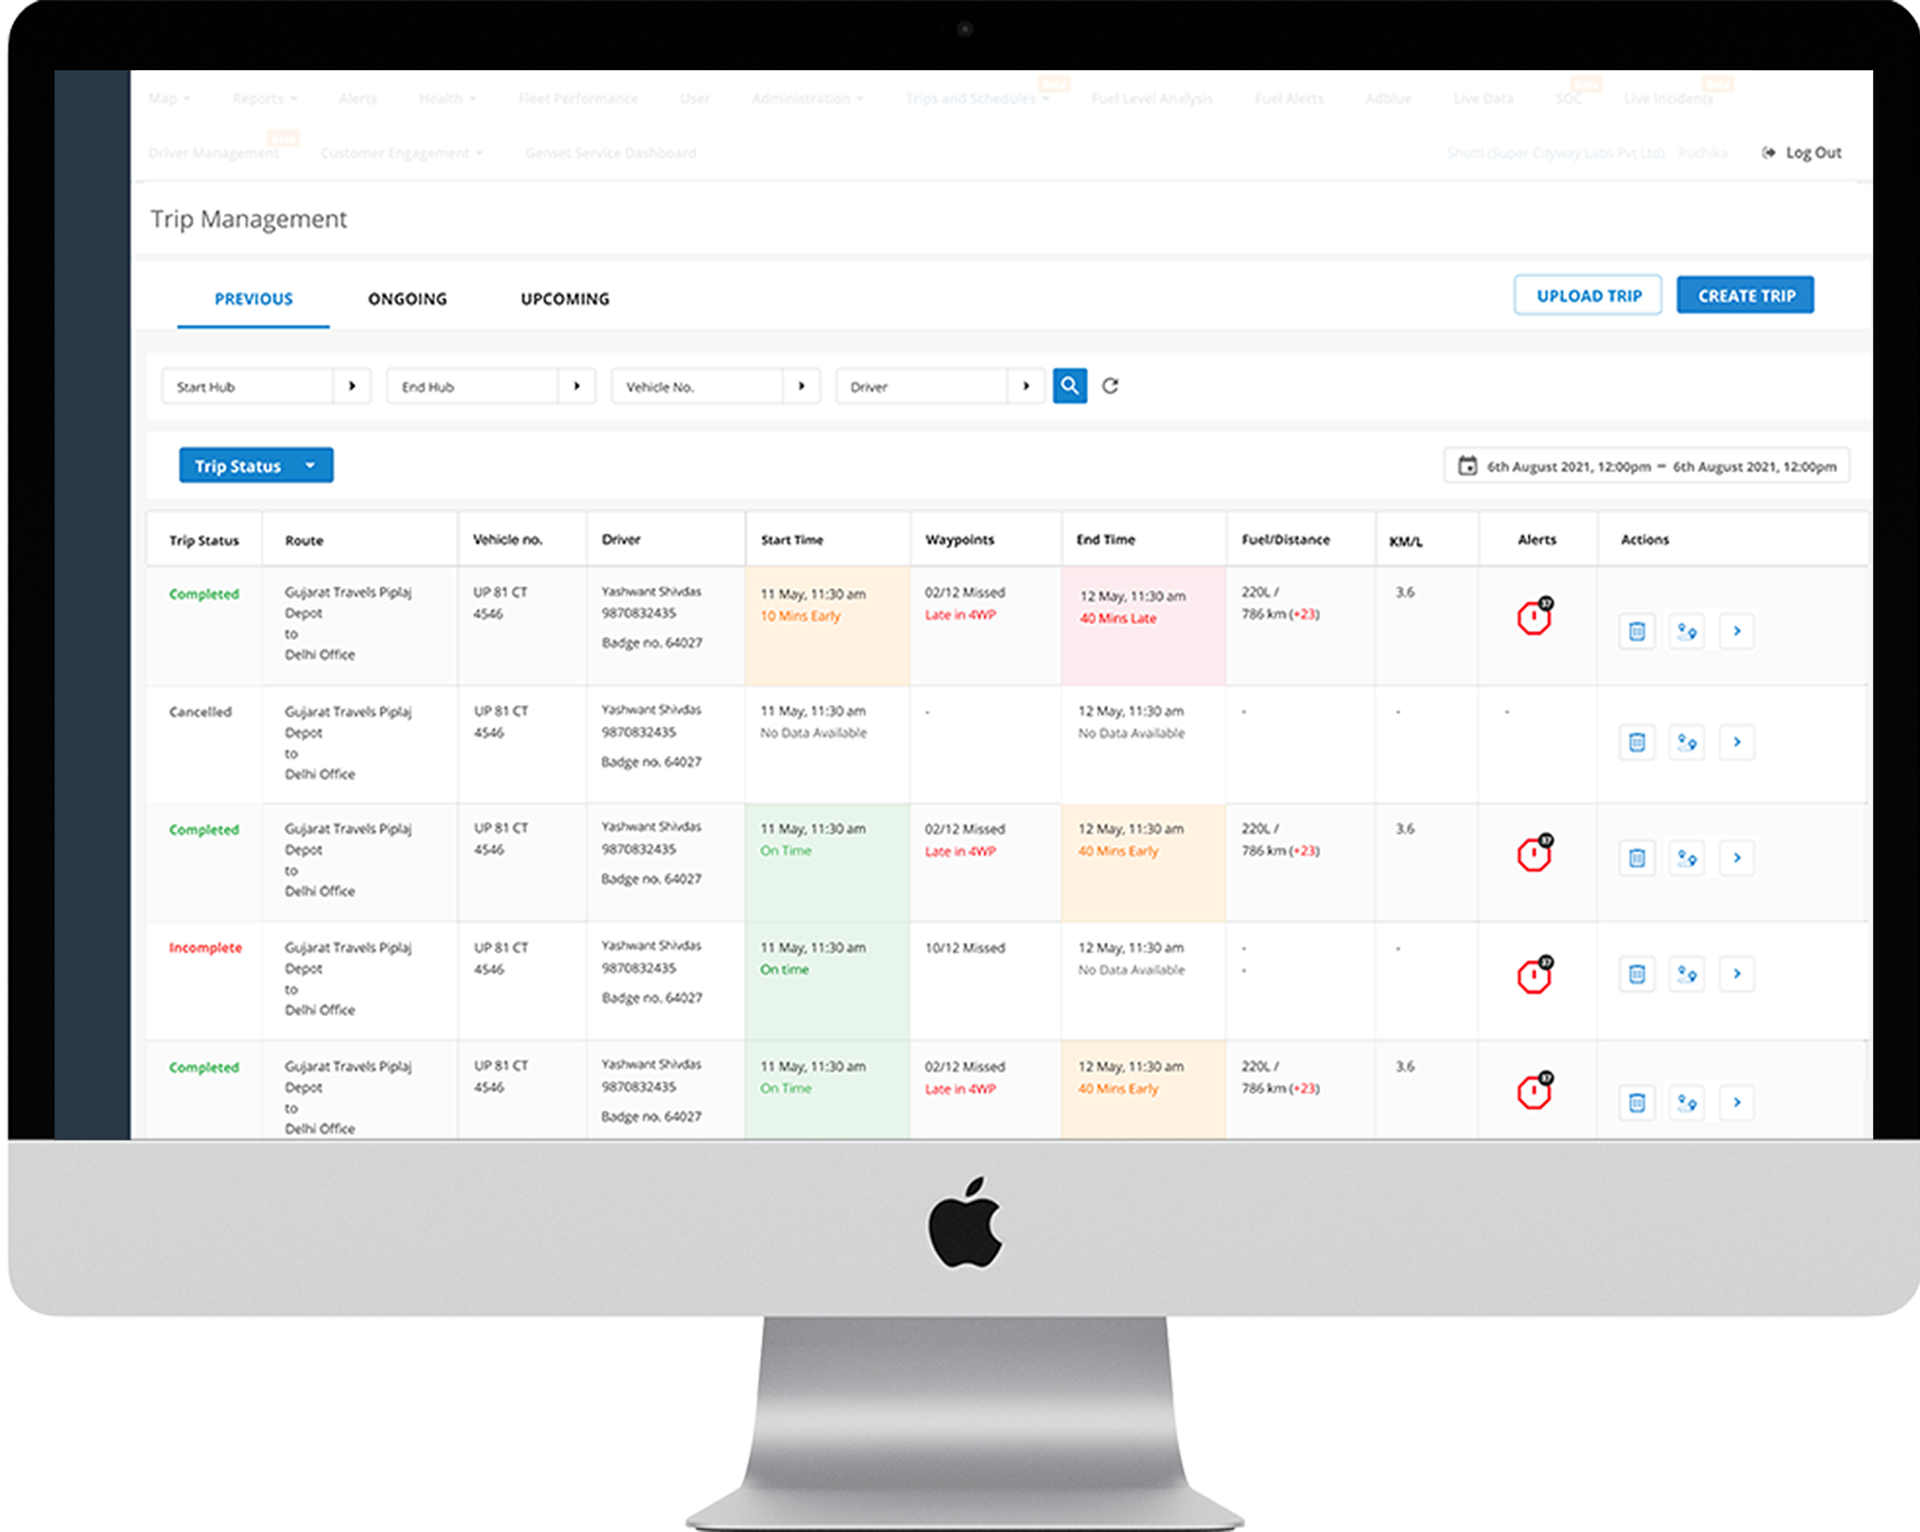
After Redesign
For the redesign version of the trip management, we created two different versions based on the use cases of both the truck and bus industries, hitting all the KPIs that were required for the user.
Upcoming Trips
The feature enables the user to see all their upcoming trips and lets them make changes if needed, such as changing the driver, time, and vehicle assigned for the trips.

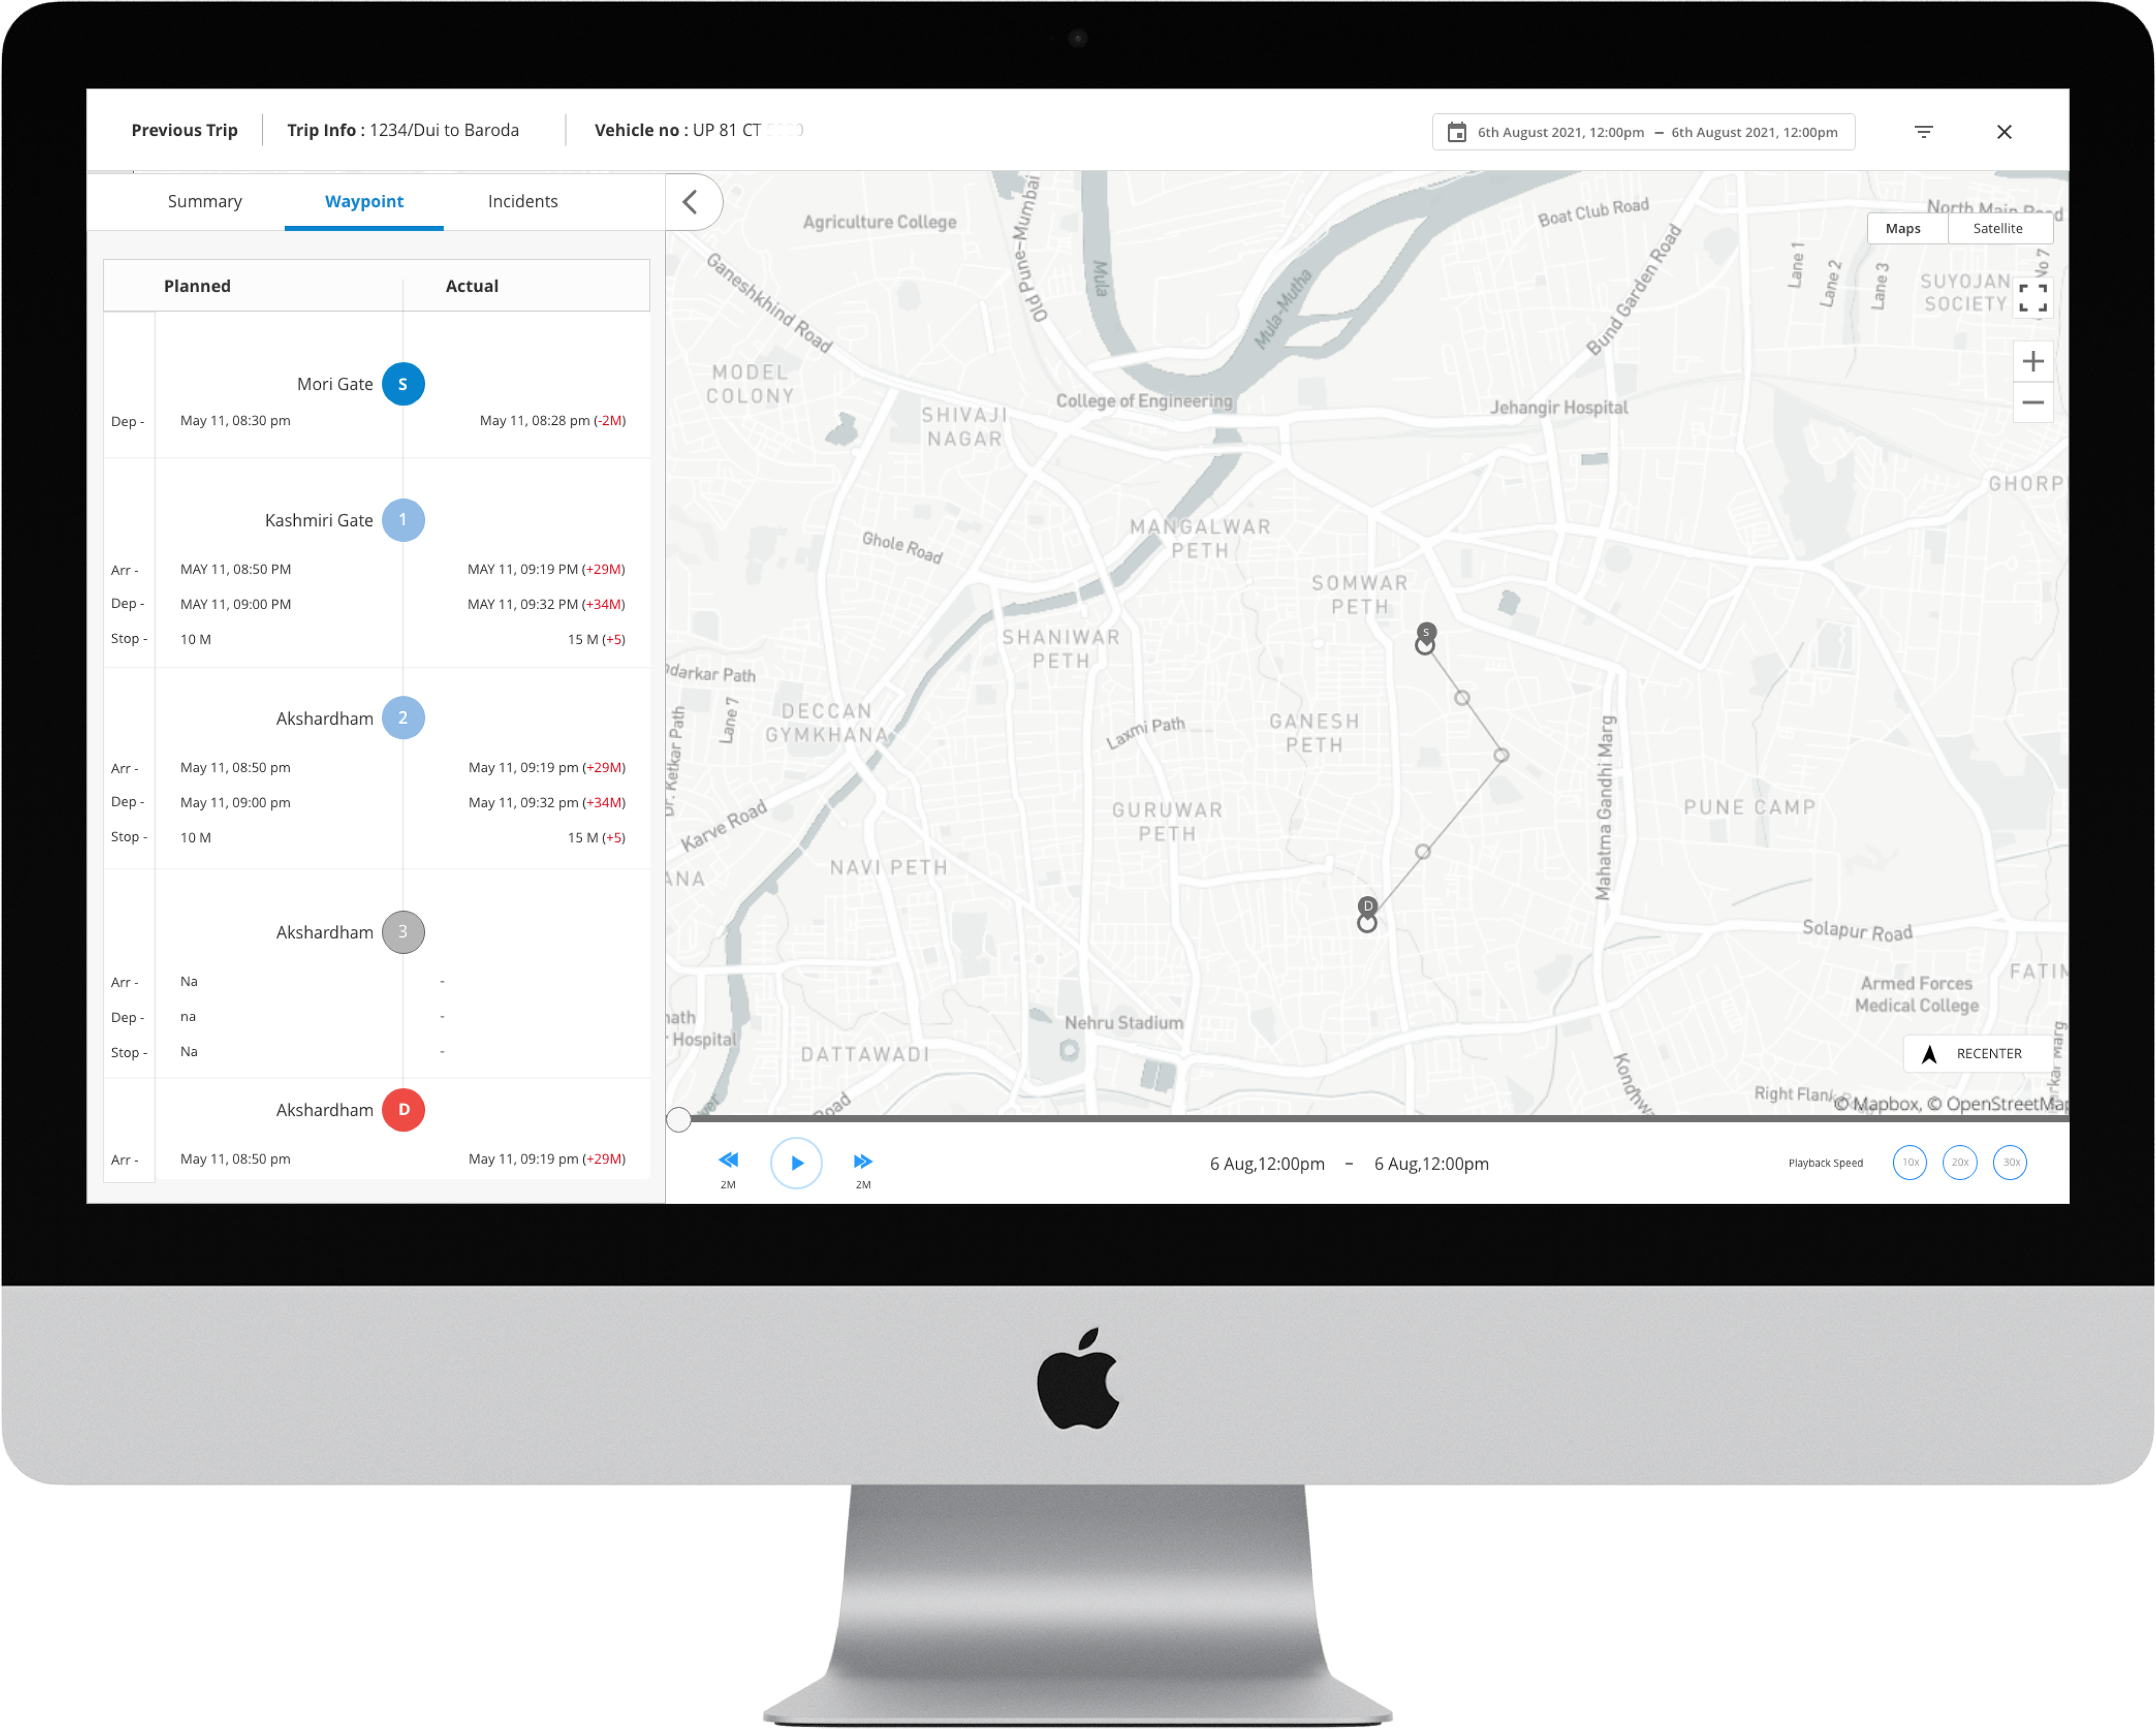
Ongoing Trips
The feature enables the user to see all live trips that are ongoing and lets them also end trips manually if necessary. The user is allowed to change the vehicle for an ongoing trip and can see the live location of the vehicle.
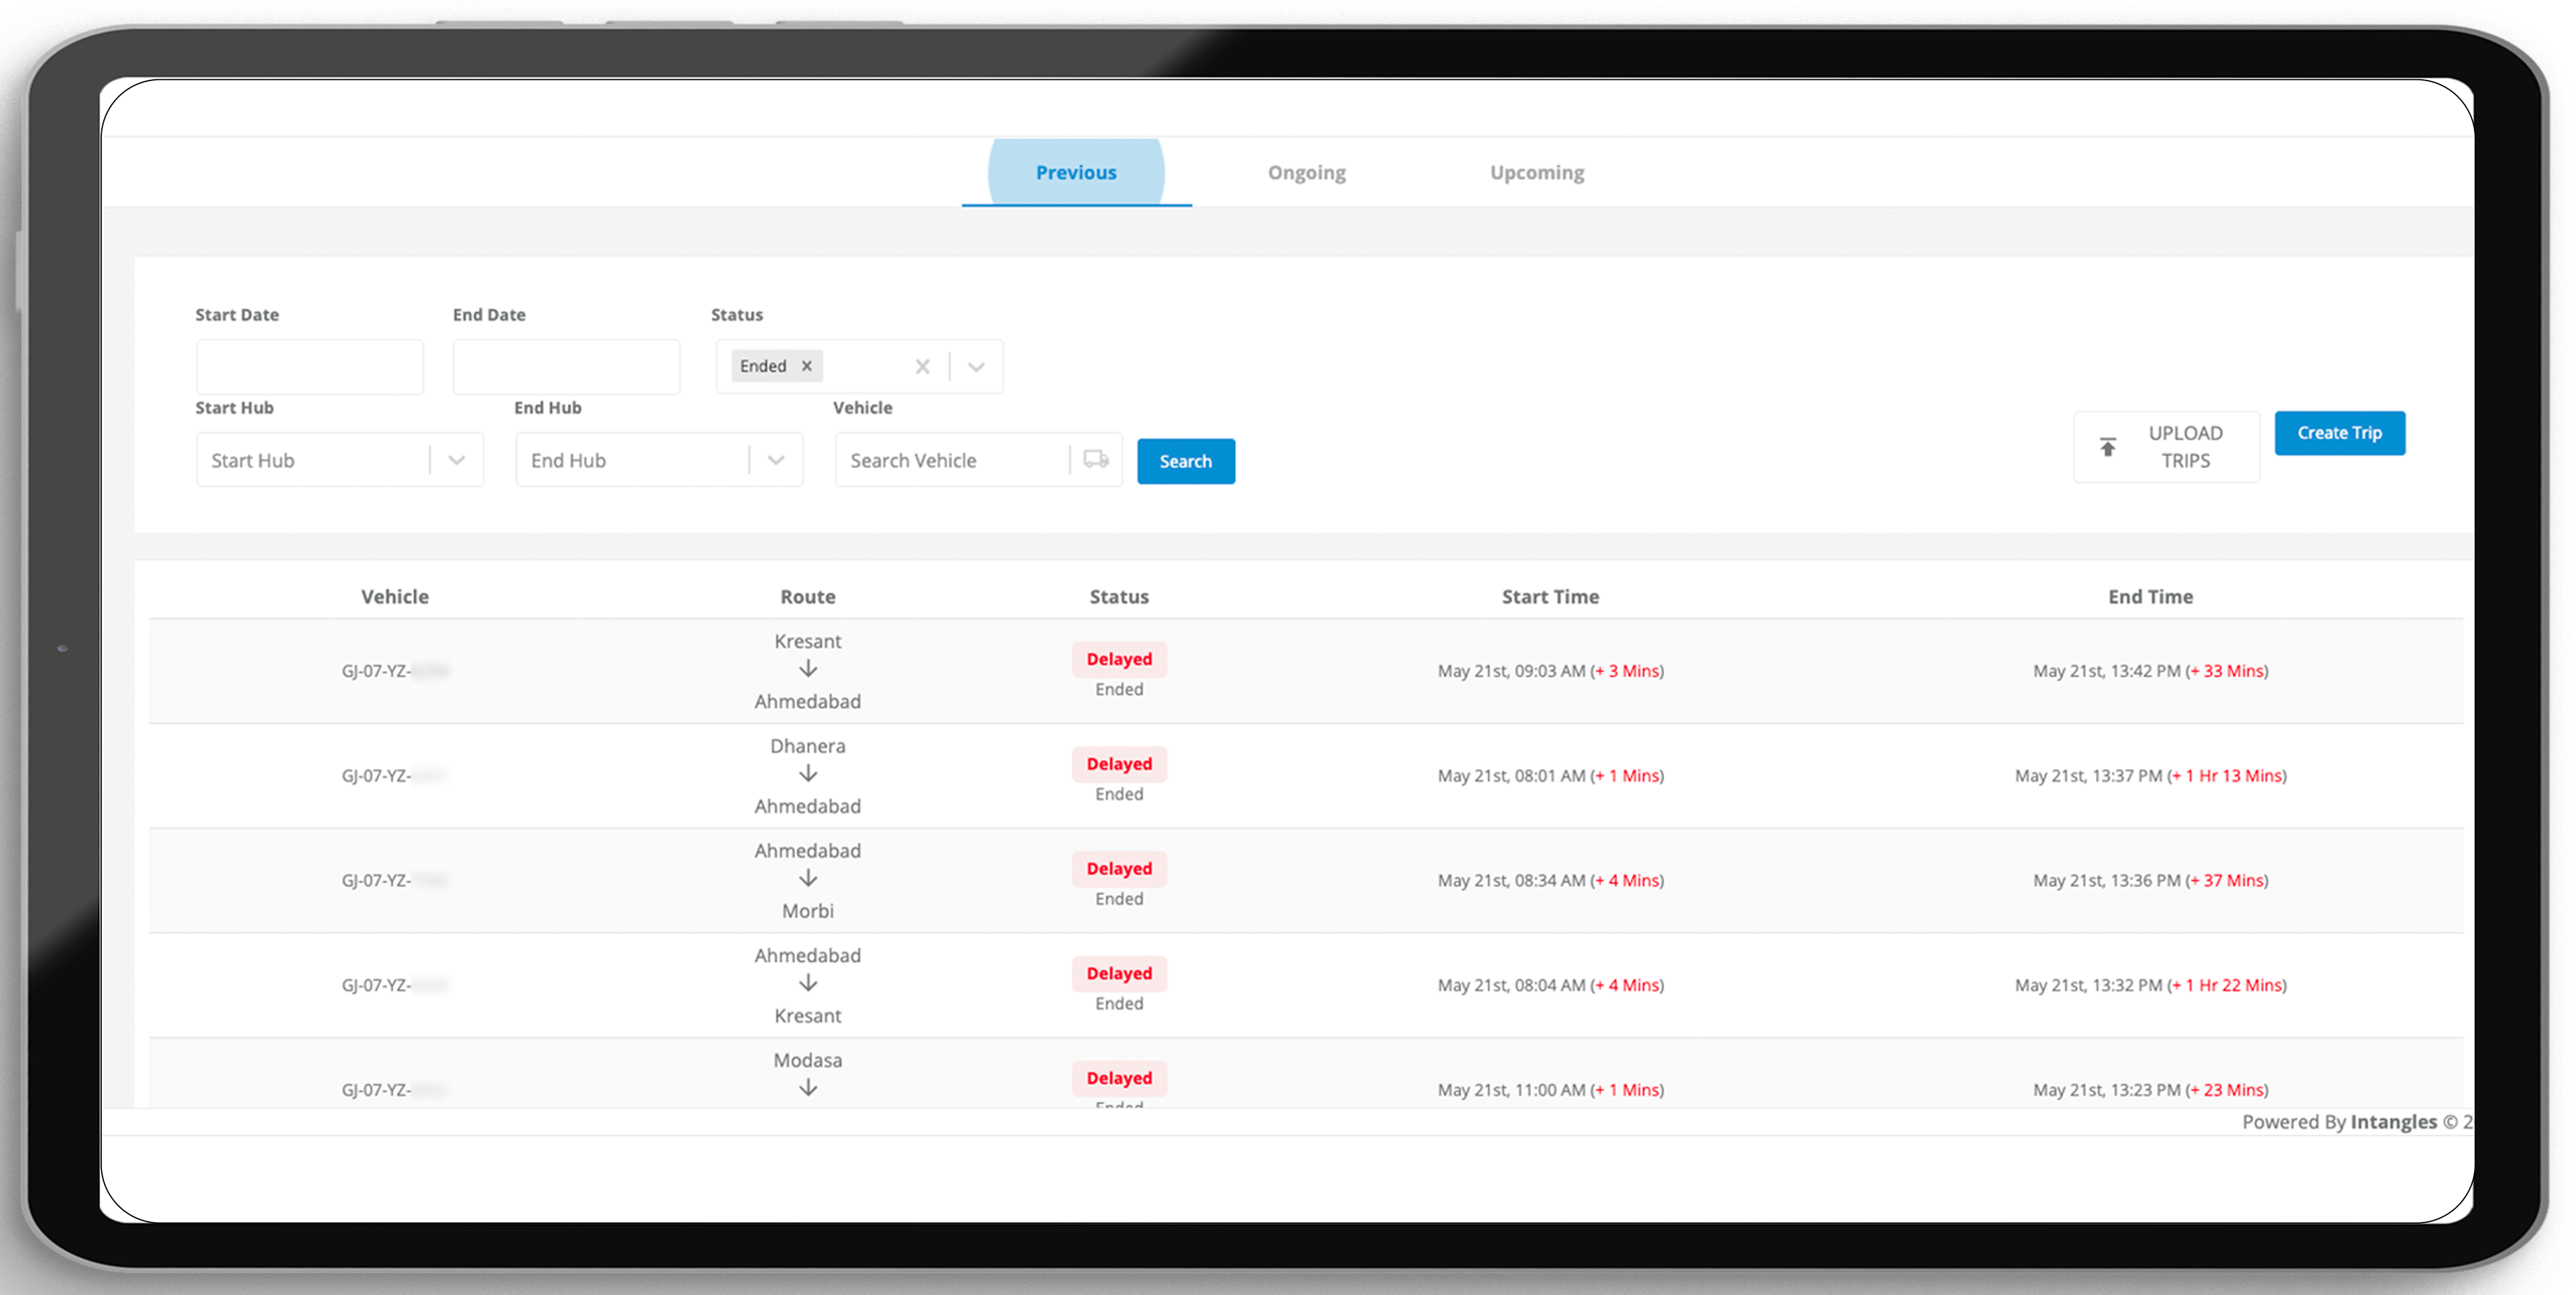
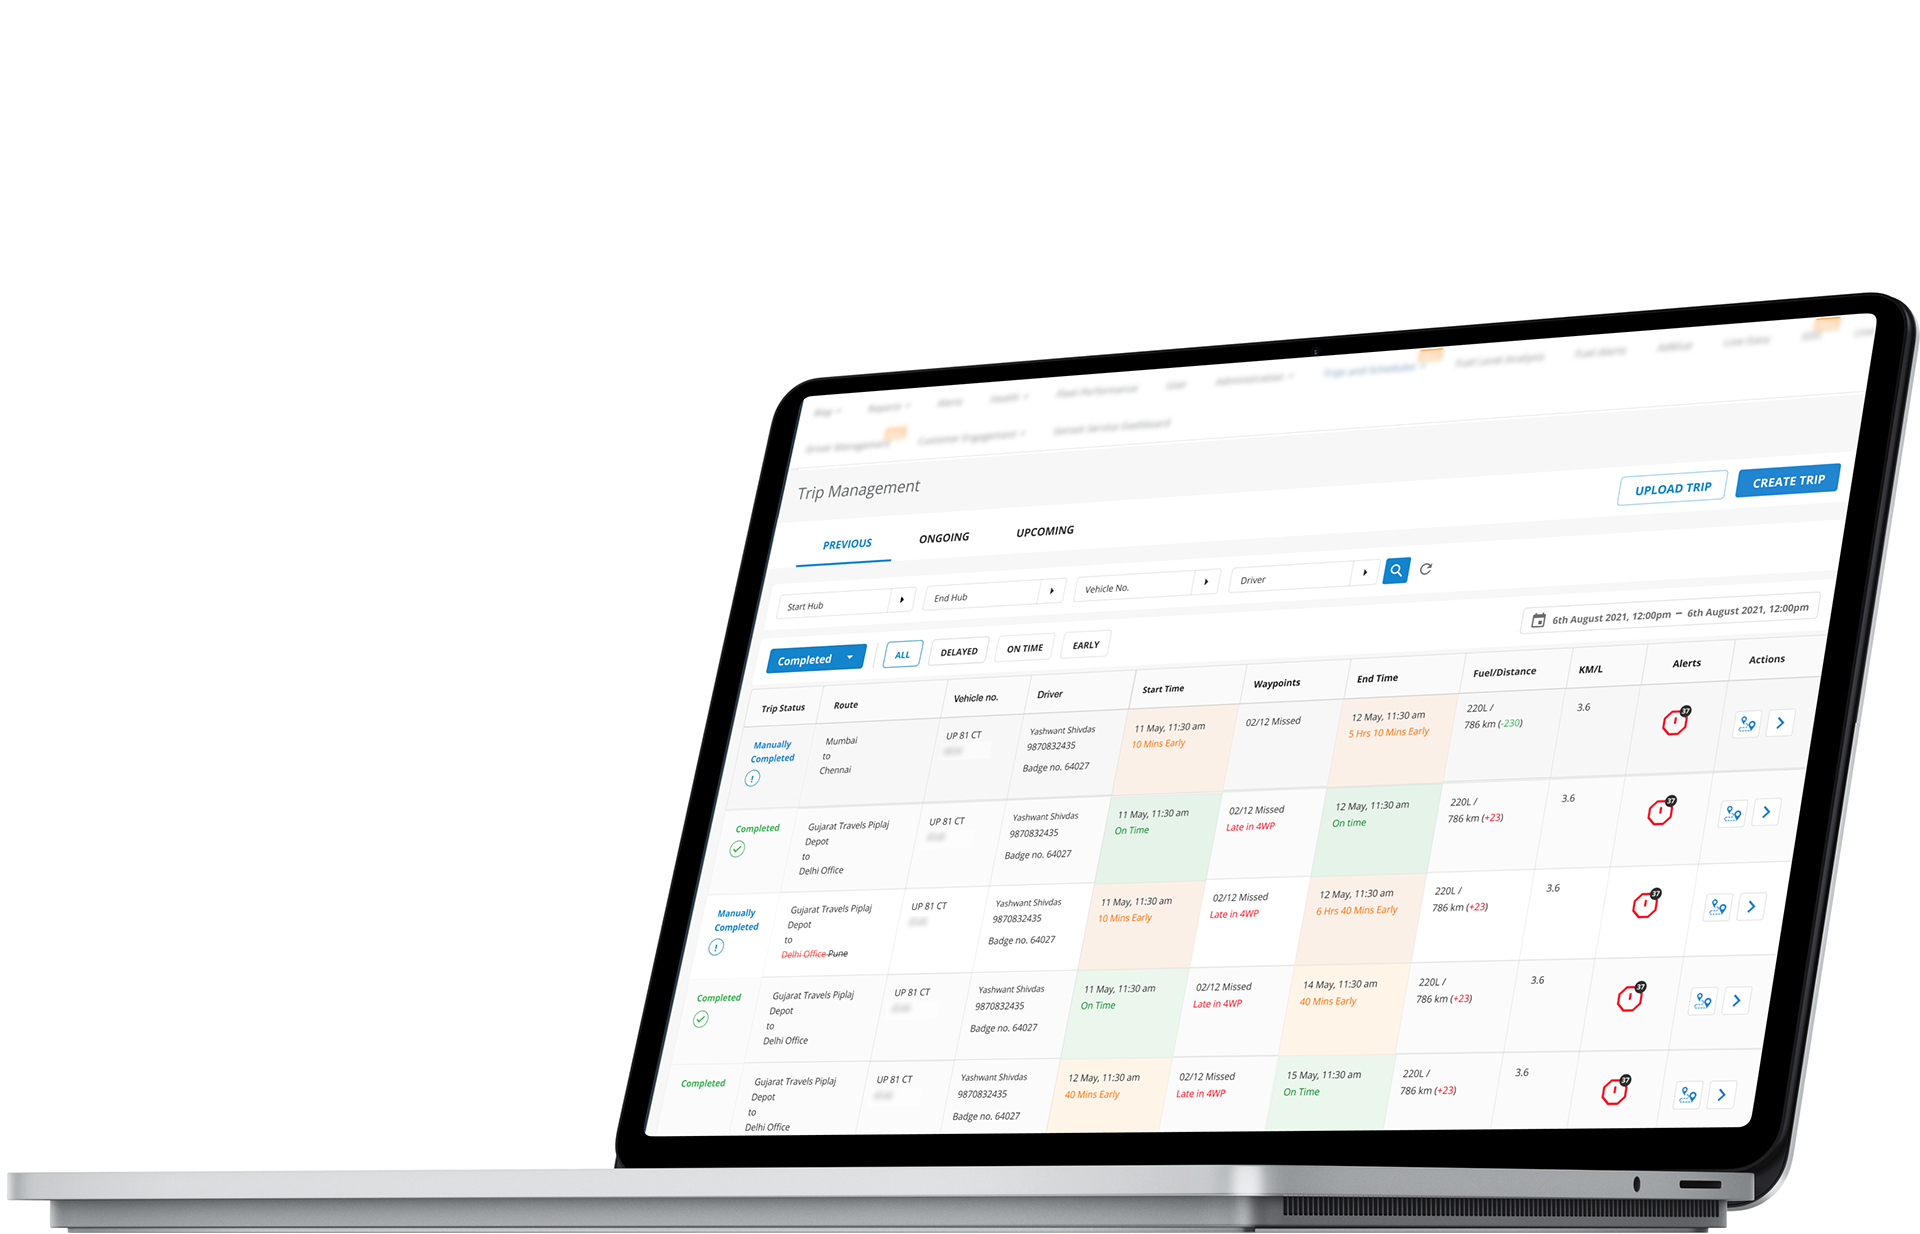
Completed Trips
The feature enables the user to see all live trips that are ongoing and lets them also end trips manually if necessary. The user is allowed to change the vehicle for an ongoing trip and can see the live location of the vehicle.
Thank You